Bermudan vs Immigrants from Colombia No Schooling Completed
COMPARE
Bermudan
Immigrants from Colombia
No Schooling Completed
No Schooling Completed Comparison
Bermudans
Immigrants from Colombia
2.1%
NO SCHOOLING COMPLETED
30.7/ 100
METRIC RATING
191st/ 347
METRIC RANK
2.4%
NO SCHOOLING COMPLETED
1.0/ 100
METRIC RATING
252nd/ 347
METRIC RANK
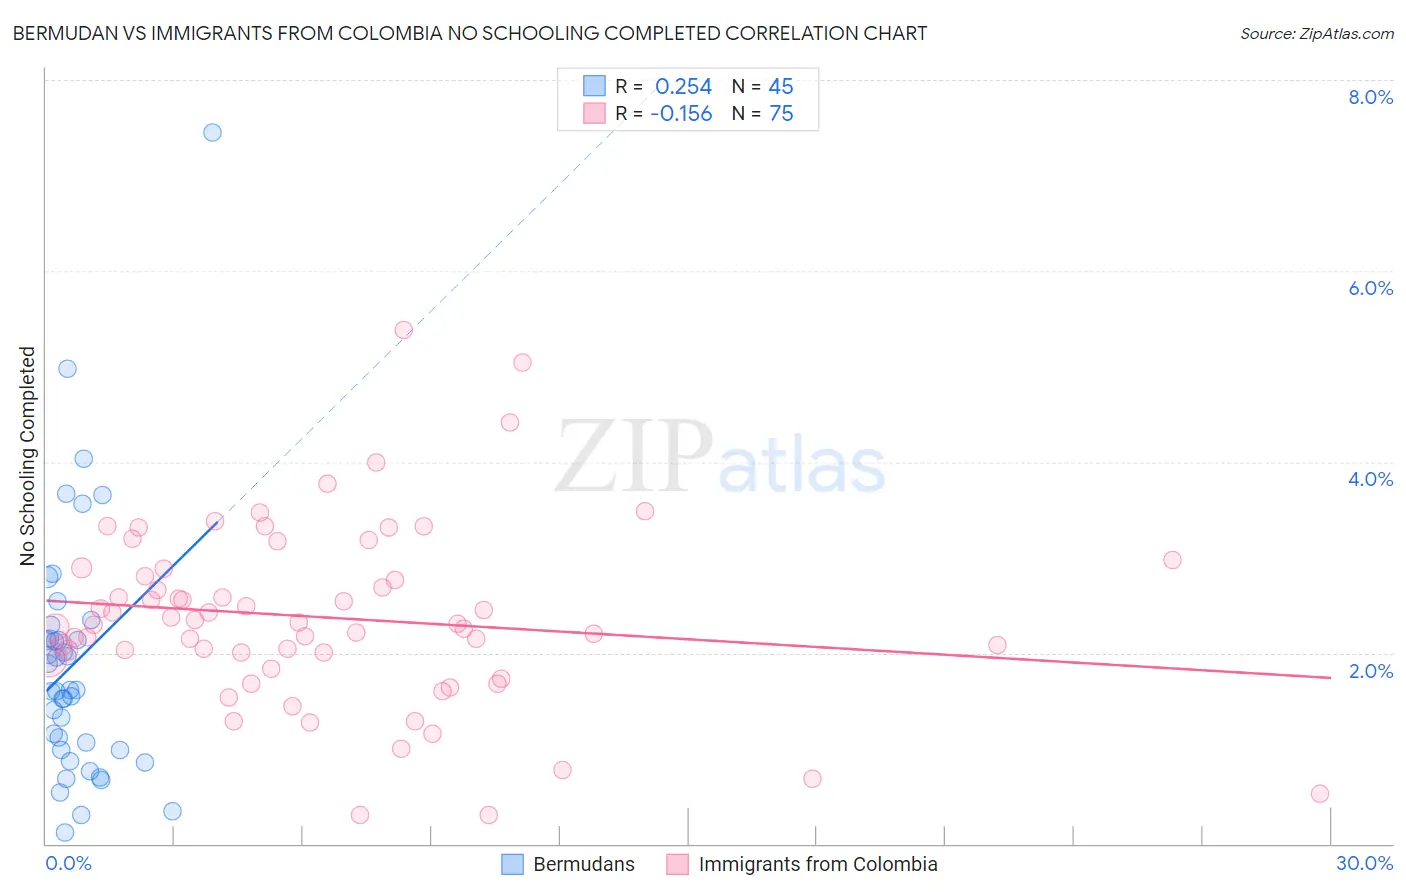
Bermudan vs Immigrants from Colombia No Schooling Completed Correlation Chart
The statistical analysis conducted on geographies consisting of 55,639,195 people shows a weak positive correlation between the proportion of Bermudans and percentage of population with no schooling in the United States with a correlation coefficient (R) of 0.254 and weighted average of 2.1%. Similarly, the statistical analysis conducted on geographies consisting of 375,786,629 people shows a poor negative correlation between the proportion of Immigrants from Colombia and percentage of population with no schooling in the United States with a correlation coefficient (R) of -0.156 and weighted average of 2.4%, a difference of 12.4%.
No Schooling Completed Correlation Summary
| Measurement | Bermudan | Immigrants from Colombia |
| Minimum | 0.12% | 0.30% |
| Maximum | 7.4% | 5.4% |
| Range | 7.3% | 5.1% |
| Mean | 1.9% | 2.4% |
| Median | 1.6% | 2.3% |
| Interquartile 25% (IQ1) | 0.98% | 1.9% |
| Interquartile 75% (IQ3) | 2.2% | 2.9% |
| Interquartile Range (IQR) | 1.2% | 0.94% |
| Standard Deviation (Sample) | 1.3% | 0.95% |
| Standard Deviation (Population) | 1.3% | 0.94% |
Similar Demographics by No Schooling Completed
Demographics Similar to Bermudans by No Schooling Completed
In terms of no schooling completed, the demographic groups most similar to Bermudans are Guamanian/Chamorro (2.2%, a difference of 0.14%), Paraguayan (2.2%, a difference of 0.21%), Spanish American (2.1%, a difference of 0.29%), Immigrants from Albania (2.2%, a difference of 0.38%), and Hawaiian (2.2%, a difference of 0.58%).
| Demographics | Rating | Rank | No Schooling Completed |
| Pima | 41.3 /100 | #184 | Average 2.1% |
| Mongolians | 40.8 /100 | #185 | Average 2.1% |
| Immigrants | Bosnia and Herzegovina | 38.6 /100 | #186 | Fair 2.1% |
| Navajo | 36.5 /100 | #187 | Fair 2.1% |
| Immigrants | Kenya | 36.2 /100 | #188 | Fair 2.1% |
| Immigrants | Egypt | 36.1 /100 | #189 | Fair 2.1% |
| Spanish Americans | 32.6 /100 | #190 | Fair 2.1% |
| Bermudans | 30.7 /100 | #191 | Fair 2.1% |
| Guamanians/Chamorros | 29.8 /100 | #192 | Fair 2.2% |
| Paraguayans | 29.3 /100 | #193 | Fair 2.2% |
| Immigrants | Albania | 28.3 /100 | #194 | Fair 2.2% |
| Hawaiians | 27.0 /100 | #195 | Fair 2.2% |
| Immigrants | Ukraine | 26.1 /100 | #196 | Fair 2.2% |
| Immigrants | Southern Europe | 23.8 /100 | #197 | Fair 2.2% |
| Immigrants | Chile | 22.7 /100 | #198 | Fair 2.2% |
Demographics Similar to Immigrants from Colombia by No Schooling Completed
In terms of no schooling completed, the demographic groups most similar to Immigrants from Colombia are Immigrants from Asia (2.4%, a difference of 0.13%), Immigrants from Eastern Africa (2.4%, a difference of 0.25%), Immigrants from Africa (2.4%, a difference of 0.45%), Ethiopian (2.4%, a difference of 0.45%), and Immigrants from Middle Africa (2.4%, a difference of 0.46%).
| Demographics | Rating | Rank | No Schooling Completed |
| Bolivians | 1.4 /100 | #245 | Tragic 2.4% |
| Immigrants | Congo | 1.4 /100 | #246 | Tragic 2.4% |
| Immigrants | Iraq | 1.3 /100 | #247 | Tragic 2.4% |
| Asians | 1.2 /100 | #248 | Tragic 2.4% |
| Jamaicans | 1.2 /100 | #249 | Tragic 2.4% |
| Immigrants | Middle Africa | 1.1 /100 | #250 | Tragic 2.4% |
| Immigrants | Africa | 1.1 /100 | #251 | Tragic 2.4% |
| Immigrants | Colombia | 1.0 /100 | #252 | Tragic 2.4% |
| Immigrants | Asia | 0.9 /100 | #253 | Tragic 2.4% |
| Immigrants | Eastern Africa | 0.9 /100 | #254 | Tragic 2.4% |
| Ethiopians | 0.8 /100 | #255 | Tragic 2.4% |
| Yaqui | 0.8 /100 | #256 | Tragic 2.4% |
| Immigrants | South America | 0.6 /100 | #257 | Tragic 2.5% |
| Assyrians/Chaldeans/Syriacs | 0.6 /100 | #258 | Tragic 2.5% |
| Immigrants | Jamaica | 0.6 /100 | #259 | Tragic 2.5% |