Spaniard vs Chinese No Schooling Completed
COMPARE
Spaniard
Chinese
No Schooling Completed
No Schooling Completed Comparison
Spaniards
Chinese
1.9%
NO SCHOOLING COMPLETED
92.3/ 100
METRIC RATING
128th/ 347
METRIC RANK
1.5%
NO SCHOOLING COMPLETED
100.0/ 100
METRIC RATING
21st/ 347
METRIC RANK
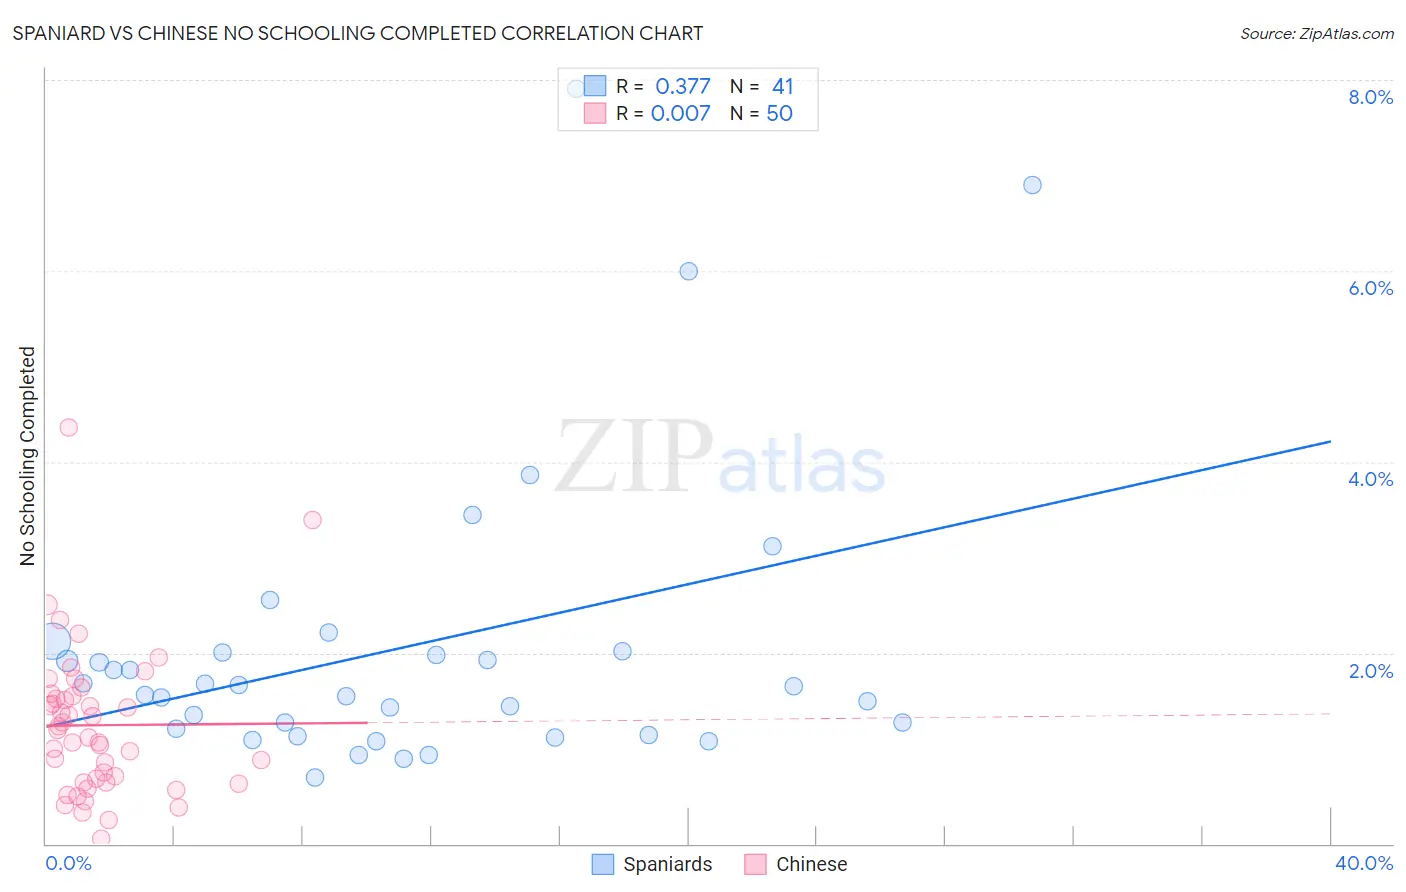
Spaniard vs Chinese No Schooling Completed Correlation Chart
The statistical analysis conducted on geographies consisting of 437,809,965 people shows a mild positive correlation between the proportion of Spaniards and percentage of population with no schooling in the United States with a correlation coefficient (R) of 0.377 and weighted average of 1.9%. Similarly, the statistical analysis conducted on geographies consisting of 64,531,891 people shows no correlation between the proportion of Chinese and percentage of population with no schooling in the United States with a correlation coefficient (R) of 0.007 and weighted average of 1.5%, a difference of 30.1%.
No Schooling Completed Correlation Summary
| Measurement | Spaniard | Chinese |
| Minimum | 0.69% | 0.048% |
| Maximum | 7.9% | 4.4% |
| Range | 7.2% | 4.3% |
| Mean | 2.1% | 1.2% |
| Median | 1.7% | 1.2% |
| Interquartile 25% (IQ1) | 1.2% | 0.65% |
| Interquartile 75% (IQ3) | 2.0% | 1.5% |
| Interquartile Range (IQR) | 0.84% | 0.90% |
| Standard Deviation (Sample) | 1.6% | 0.79% |
| Standard Deviation (Population) | 1.5% | 0.78% |
Similar Demographics by No Schooling Completed
Demographics Similar to Spaniards by No Schooling Completed
In terms of no schooling completed, the demographic groups most similar to Spaniards are Israeli (1.9%, a difference of 0.090%), Seminole (1.9%, a difference of 0.14%), Immigrants from Romania (1.9%, a difference of 0.15%), Palestinian (1.9%, a difference of 0.25%), and Immigrants from Hungary (1.9%, a difference of 0.35%).
| Demographics | Rating | Rank | No Schooling Completed |
| Immigrants | Croatia | 94.5 /100 | #121 | Exceptional 1.9% |
| Cree | 94.5 /100 | #122 | Exceptional 1.9% |
| Immigrants | Kuwait | 93.9 /100 | #123 | Exceptional 1.9% |
| Cambodians | 93.8 /100 | #124 | Exceptional 1.9% |
| Immigrants | Europe | 93.7 /100 | #125 | Exceptional 1.9% |
| Immigrants | Romania | 92.6 /100 | #126 | Exceptional 1.9% |
| Israelis | 92.4 /100 | #127 | Exceptional 1.9% |
| Spaniards | 92.3 /100 | #128 | Exceptional 1.9% |
| Seminole | 92.0 /100 | #129 | Exceptional 1.9% |
| Palestinians | 91.8 /100 | #130 | Exceptional 1.9% |
| Immigrants | Hungary | 91.6 /100 | #131 | Exceptional 1.9% |
| Colville | 90.4 /100 | #132 | Exceptional 1.9% |
| Immigrants | Turkey | 90.2 /100 | #133 | Exceptional 1.9% |
| Menominee | 89.6 /100 | #134 | Excellent 1.9% |
| Hmong | 88.5 /100 | #135 | Excellent 1.9% |
Demographics Similar to Chinese by No Schooling Completed
In terms of no schooling completed, the demographic groups most similar to Chinese are Alaska Native (1.5%, a difference of 0.090%), European (1.5%, a difference of 0.34%), Welsh (1.5%, a difference of 0.37%), Alaskan Athabascan (1.5%, a difference of 0.49%), and Danish (1.5%, a difference of 0.60%).
| Demographics | Rating | Rank | No Schooling Completed |
| Scotch-Irish | 100.0 /100 | #14 | Exceptional 1.5% |
| Tlingit-Haida | 100.0 /100 | #15 | Exceptional 1.5% |
| Finns | 100.0 /100 | #16 | Exceptional 1.5% |
| Croatians | 100.0 /100 | #17 | Exceptional 1.5% |
| Danes | 100.0 /100 | #18 | Exceptional 1.5% |
| Alaskan Athabascans | 100.0 /100 | #19 | Exceptional 1.5% |
| Welsh | 100.0 /100 | #20 | Exceptional 1.5% |
| Chinese | 100.0 /100 | #21 | Exceptional 1.5% |
| Alaska Natives | 100.0 /100 | #22 | Exceptional 1.5% |
| Europeans | 100.0 /100 | #23 | Exceptional 1.5% |
| Pennsylvania Germans | 100.0 /100 | #24 | Exceptional 1.5% |
| French | 100.0 /100 | #25 | Exceptional 1.5% |
| Czechs | 100.0 /100 | #26 | Exceptional 1.5% |
| Scandinavians | 100.0 /100 | #27 | Exceptional 1.5% |
| French Canadians | 100.0 /100 | #28 | Exceptional 1.5% |