Spaniard vs Immigrants from Ukraine No Schooling Completed
COMPARE
Spaniard
Immigrants from Ukraine
No Schooling Completed
No Schooling Completed Comparison
Spaniards
Immigrants from Ukraine
1.9%
NO SCHOOLING COMPLETED
92.3/ 100
METRIC RATING
128th/ 347
METRIC RANK
2.2%
NO SCHOOLING COMPLETED
26.1/ 100
METRIC RATING
196th/ 347
METRIC RANK
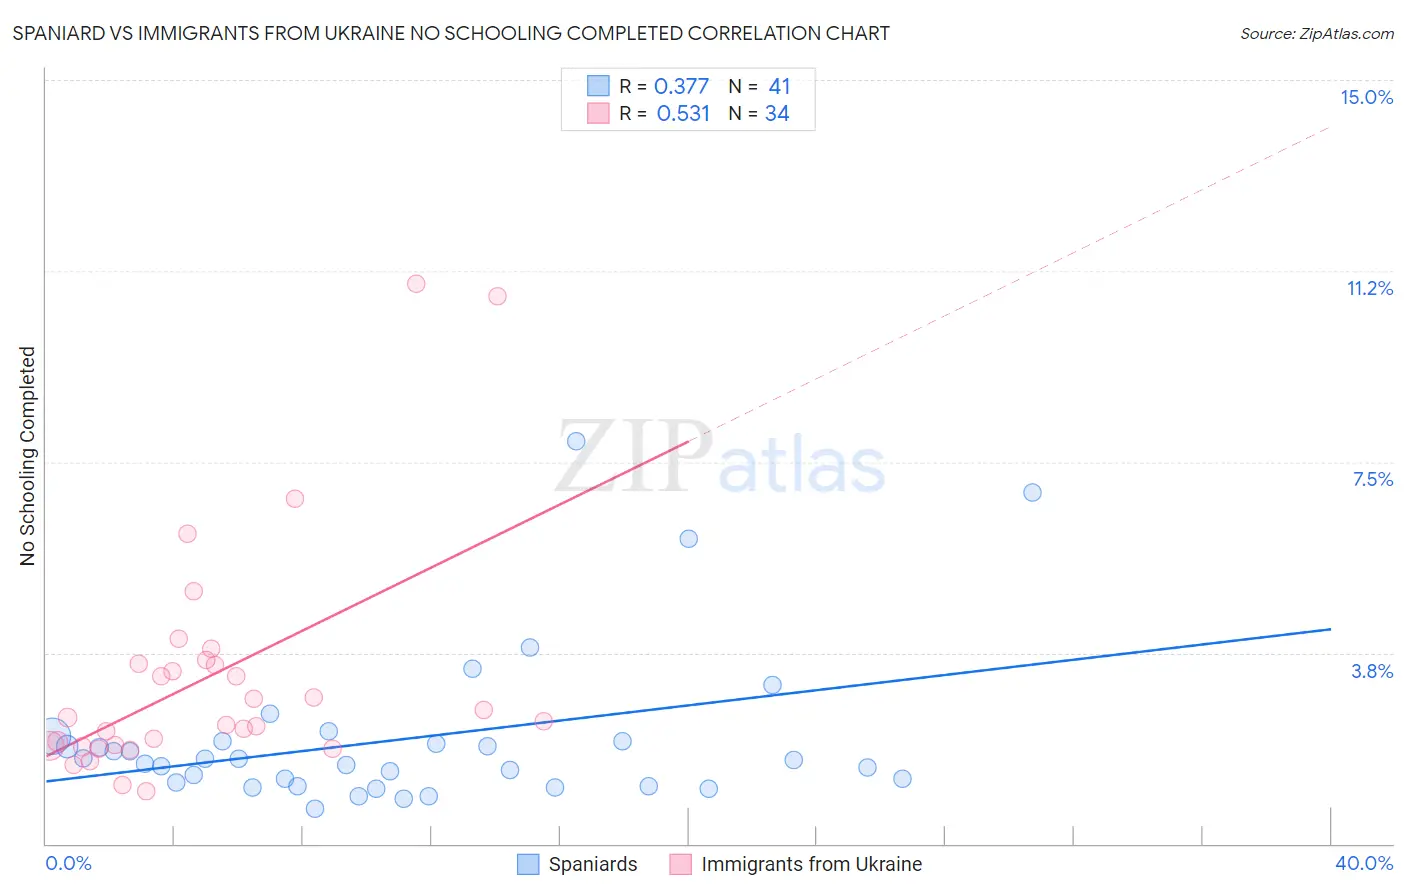
Spaniard vs Immigrants from Ukraine No Schooling Completed Correlation Chart
The statistical analysis conducted on geographies consisting of 437,809,965 people shows a mild positive correlation between the proportion of Spaniards and percentage of population with no schooling in the United States with a correlation coefficient (R) of 0.377 and weighted average of 1.9%. Similarly, the statistical analysis conducted on geographies consisting of 287,112,506 people shows a substantial positive correlation between the proportion of Immigrants from Ukraine and percentage of population with no schooling in the United States with a correlation coefficient (R) of 0.531 and weighted average of 2.2%, a difference of 12.9%.
No Schooling Completed Correlation Summary
| Measurement | Spaniard | Immigrants from Ukraine |
| Minimum | 0.69% | 1.0% |
| Maximum | 7.9% | 11.0% |
| Range | 7.2% | 9.9% |
| Mean | 2.1% | 3.3% |
| Median | 1.7% | 2.4% |
| Interquartile 25% (IQ1) | 1.2% | 1.9% |
| Interquartile 75% (IQ3) | 2.0% | 3.5% |
| Interquartile Range (IQR) | 0.84% | 1.6% |
| Standard Deviation (Sample) | 1.6% | 2.3% |
| Standard Deviation (Population) | 1.5% | 2.3% |
Similar Demographics by No Schooling Completed
Demographics Similar to Spaniards by No Schooling Completed
In terms of no schooling completed, the demographic groups most similar to Spaniards are Israeli (1.9%, a difference of 0.090%), Seminole (1.9%, a difference of 0.14%), Immigrants from Romania (1.9%, a difference of 0.15%), Palestinian (1.9%, a difference of 0.25%), and Immigrants from Hungary (1.9%, a difference of 0.35%).
| Demographics | Rating | Rank | No Schooling Completed |
| Immigrants | Croatia | 94.5 /100 | #121 | Exceptional 1.9% |
| Cree | 94.5 /100 | #122 | Exceptional 1.9% |
| Immigrants | Kuwait | 93.9 /100 | #123 | Exceptional 1.9% |
| Cambodians | 93.8 /100 | #124 | Exceptional 1.9% |
| Immigrants | Europe | 93.7 /100 | #125 | Exceptional 1.9% |
| Immigrants | Romania | 92.6 /100 | #126 | Exceptional 1.9% |
| Israelis | 92.4 /100 | #127 | Exceptional 1.9% |
| Spaniards | 92.3 /100 | #128 | Exceptional 1.9% |
| Seminole | 92.0 /100 | #129 | Exceptional 1.9% |
| Palestinians | 91.8 /100 | #130 | Exceptional 1.9% |
| Immigrants | Hungary | 91.6 /100 | #131 | Exceptional 1.9% |
| Colville | 90.4 /100 | #132 | Exceptional 1.9% |
| Immigrants | Turkey | 90.2 /100 | #133 | Exceptional 1.9% |
| Menominee | 89.6 /100 | #134 | Excellent 1.9% |
| Hmong | 88.5 /100 | #135 | Excellent 1.9% |
Demographics Similar to Immigrants from Ukraine by No Schooling Completed
In terms of no schooling completed, the demographic groups most similar to Immigrants from Ukraine are Hawaiian (2.2%, a difference of 0.15%), Immigrants from Albania (2.2%, a difference of 0.35%), Immigrants from Southern Europe (2.2%, a difference of 0.41%), Paraguayan (2.2%, a difference of 0.52%), and Guamanian/Chamorro (2.2%, a difference of 0.59%).
| Demographics | Rating | Rank | No Schooling Completed |
| Immigrants | Egypt | 36.1 /100 | #189 | Fair 2.1% |
| Spanish Americans | 32.6 /100 | #190 | Fair 2.1% |
| Bermudans | 30.7 /100 | #191 | Fair 2.1% |
| Guamanians/Chamorros | 29.8 /100 | #192 | Fair 2.2% |
| Paraguayans | 29.3 /100 | #193 | Fair 2.2% |
| Immigrants | Albania | 28.3 /100 | #194 | Fair 2.2% |
| Hawaiians | 27.0 /100 | #195 | Fair 2.2% |
| Immigrants | Ukraine | 26.1 /100 | #196 | Fair 2.2% |
| Immigrants | Southern Europe | 23.8 /100 | #197 | Fair 2.2% |
| Immigrants | Chile | 22.7 /100 | #198 | Fair 2.2% |
| Africans | 21.8 /100 | #199 | Fair 2.2% |
| Immigrants | Northern Africa | 19.5 /100 | #200 | Poor 2.2% |
| Costa Ricans | 17.1 /100 | #201 | Poor 2.2% |
| Moroccans | 13.7 /100 | #202 | Poor 2.2% |
| Laotians | 13.3 /100 | #203 | Poor 2.2% |