Spaniard vs Cherokee No Schooling Completed
COMPARE
Spaniard
Cherokee
No Schooling Completed
No Schooling Completed Comparison
Spaniards
Cherokee
1.9%
NO SCHOOLING COMPLETED
92.3/ 100
METRIC RATING
128th/ 347
METRIC RANK
1.7%
NO SCHOOLING COMPLETED
99.3/ 100
METRIC RATING
76th/ 347
METRIC RANK
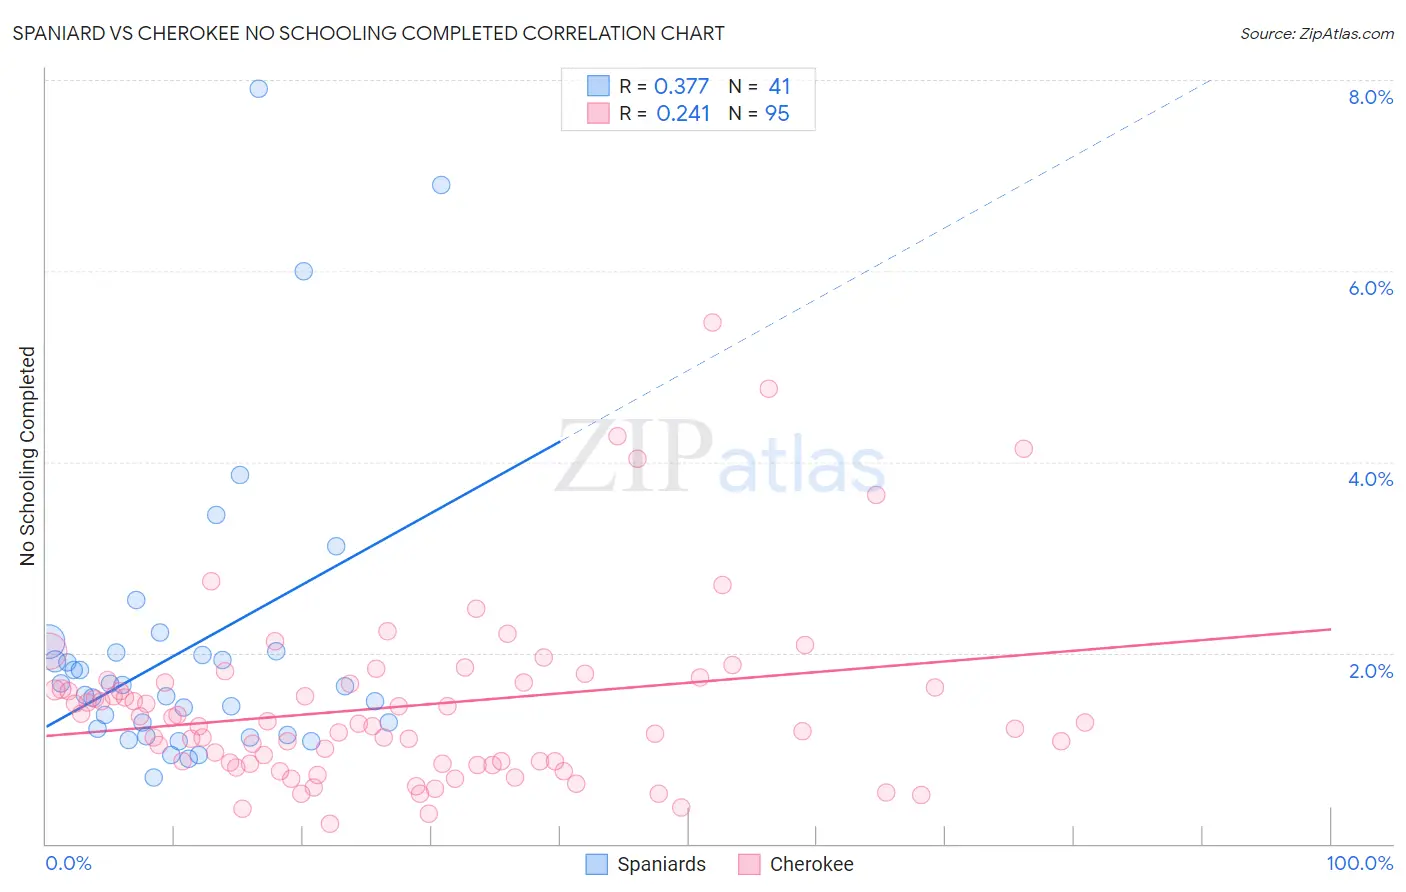
Spaniard vs Cherokee No Schooling Completed Correlation Chart
The statistical analysis conducted on geographies consisting of 437,809,965 people shows a mild positive correlation between the proportion of Spaniards and percentage of population with no schooling in the United States with a correlation coefficient (R) of 0.377 and weighted average of 1.9%. Similarly, the statistical analysis conducted on geographies consisting of 484,763,957 people shows a weak positive correlation between the proportion of Cherokee and percentage of population with no schooling in the United States with a correlation coefficient (R) of 0.241 and weighted average of 1.7%, a difference of 10.2%.
No Schooling Completed Correlation Summary
| Measurement | Spaniard | Cherokee |
| Minimum | 0.69% | 0.21% |
| Maximum | 7.9% | 5.5% |
| Range | 7.2% | 5.2% |
| Mean | 2.1% | 1.4% |
| Median | 1.7% | 1.3% |
| Interquartile 25% (IQ1) | 1.2% | 0.84% |
| Interquartile 75% (IQ3) | 2.0% | 1.7% |
| Interquartile Range (IQR) | 0.84% | 0.85% |
| Standard Deviation (Sample) | 1.6% | 0.94% |
| Standard Deviation (Population) | 1.5% | 0.94% |
Similar Demographics by No Schooling Completed
Demographics Similar to Spaniards by No Schooling Completed
In terms of no schooling completed, the demographic groups most similar to Spaniards are Israeli (1.9%, a difference of 0.090%), Seminole (1.9%, a difference of 0.14%), Immigrants from Romania (1.9%, a difference of 0.15%), Palestinian (1.9%, a difference of 0.25%), and Immigrants from Hungary (1.9%, a difference of 0.35%).
| Demographics | Rating | Rank | No Schooling Completed |
| Immigrants | Croatia | 94.5 /100 | #121 | Exceptional 1.9% |
| Cree | 94.5 /100 | #122 | Exceptional 1.9% |
| Immigrants | Kuwait | 93.9 /100 | #123 | Exceptional 1.9% |
| Cambodians | 93.8 /100 | #124 | Exceptional 1.9% |
| Immigrants | Europe | 93.7 /100 | #125 | Exceptional 1.9% |
| Immigrants | Romania | 92.6 /100 | #126 | Exceptional 1.9% |
| Israelis | 92.4 /100 | #127 | Exceptional 1.9% |
| Spaniards | 92.3 /100 | #128 | Exceptional 1.9% |
| Seminole | 92.0 /100 | #129 | Exceptional 1.9% |
| Palestinians | 91.8 /100 | #130 | Exceptional 1.9% |
| Immigrants | Hungary | 91.6 /100 | #131 | Exceptional 1.9% |
| Colville | 90.4 /100 | #132 | Exceptional 1.9% |
| Immigrants | Turkey | 90.2 /100 | #133 | Exceptional 1.9% |
| Menominee | 89.6 /100 | #134 | Excellent 1.9% |
| Hmong | 88.5 /100 | #135 | Excellent 1.9% |
Demographics Similar to Cherokee by No Schooling Completed
In terms of no schooling completed, the demographic groups most similar to Cherokee are Immigrants from Belgium (1.7%, a difference of 0.040%), Immigrants from Sweden (1.7%, a difference of 0.15%), Delaware (1.7%, a difference of 0.19%), Macedonian (1.7%, a difference of 0.27%), and Cypriot (1.7%, a difference of 0.28%).
| Demographics | Rating | Rank | No Schooling Completed |
| Chickasaw | 99.6 /100 | #69 | Exceptional 1.7% |
| Immigrants | Netherlands | 99.6 /100 | #70 | Exceptional 1.7% |
| Immigrants | England | 99.5 /100 | #71 | Exceptional 1.7% |
| Cajuns | 99.5 /100 | #72 | Exceptional 1.7% |
| Immigrants | India | 99.4 /100 | #73 | Exceptional 1.7% |
| Zimbabweans | 99.4 /100 | #74 | Exceptional 1.7% |
| Immigrants | Belgium | 99.3 /100 | #75 | Exceptional 1.7% |
| Cherokee | 99.3 /100 | #76 | Exceptional 1.7% |
| Immigrants | Sweden | 99.3 /100 | #77 | Exceptional 1.7% |
| Delaware | 99.3 /100 | #78 | Exceptional 1.7% |
| Macedonians | 99.3 /100 | #79 | Exceptional 1.7% |
| Cypriots | 99.3 /100 | #80 | Exceptional 1.7% |
| Icelanders | 99.3 /100 | #81 | Exceptional 1.7% |
| Immigrants | South Africa | 99.3 /100 | #82 | Exceptional 1.7% |
| Potawatomi | 99.3 /100 | #83 | Exceptional 1.7% |