Spaniard vs Immigrants from South Central Asia No Schooling Completed
COMPARE
Spaniard
Immigrants from South Central Asia
No Schooling Completed
No Schooling Completed Comparison
Spaniards
Immigrants from South Central Asia
1.9%
NO SCHOOLING COMPLETED
92.3/ 100
METRIC RATING
128th/ 347
METRIC RANK
2.0%
NO SCHOOLING COMPLETED
80.0/ 100
METRIC RATING
143rd/ 347
METRIC RANK
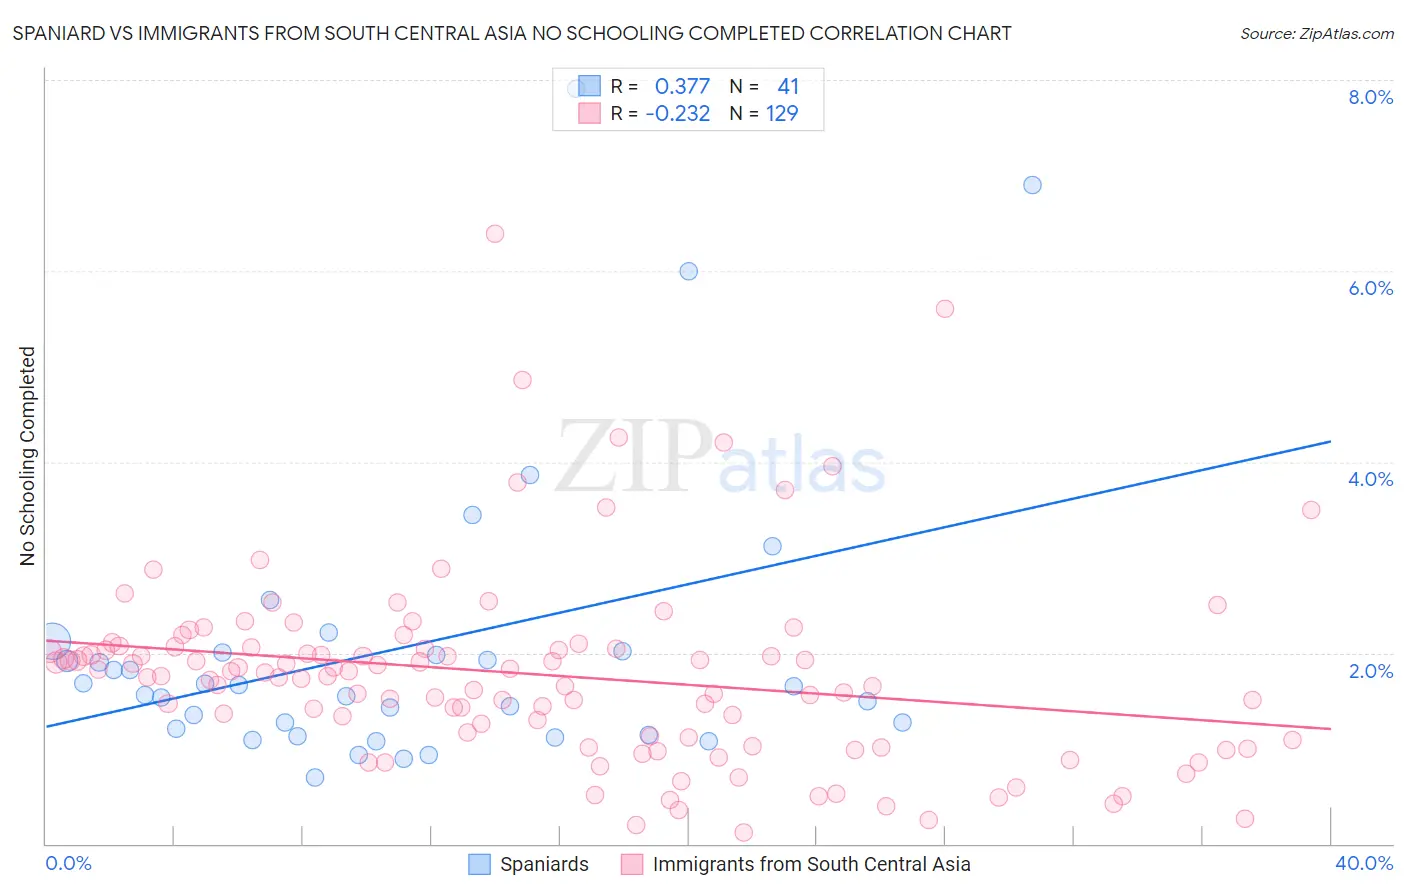
Spaniard vs Immigrants from South Central Asia No Schooling Completed Correlation Chart
The statistical analysis conducted on geographies consisting of 437,809,965 people shows a mild positive correlation between the proportion of Spaniards and percentage of population with no schooling in the United States with a correlation coefficient (R) of 0.377 and weighted average of 1.9%. Similarly, the statistical analysis conducted on geographies consisting of 466,715,377 people shows a weak negative correlation between the proportion of Immigrants from South Central Asia and percentage of population with no schooling in the United States with a correlation coefficient (R) of -0.232 and weighted average of 2.0%, a difference of 4.0%.
No Schooling Completed Correlation Summary
| Measurement | Spaniard | Immigrants from South Central Asia |
| Minimum | 0.69% | 0.12% |
| Maximum | 7.9% | 6.4% |
| Range | 7.2% | 6.3% |
| Mean | 2.1% | 1.8% |
| Median | 1.7% | 1.8% |
| Interquartile 25% (IQ1) | 1.2% | 1.1% |
| Interquartile 75% (IQ3) | 2.0% | 2.1% |
| Interquartile Range (IQR) | 0.84% | 0.95% |
| Standard Deviation (Sample) | 1.6% | 1.0% |
| Standard Deviation (Population) | 1.5% | 1.0% |
Demographics Similar to Spaniards and Immigrants from South Central Asia by No Schooling Completed
In terms of no schooling completed, the demographic groups most similar to Spaniards are Israeli (1.9%, a difference of 0.090%), Seminole (1.9%, a difference of 0.14%), Immigrants from Romania (1.9%, a difference of 0.15%), Palestinian (1.9%, a difference of 0.25%), and Immigrants from Hungary (1.9%, a difference of 0.35%). Similarly, the demographic groups most similar to Immigrants from South Central Asia are Alsatian (2.0%, a difference of 0.20%), Immigrants from Iran (2.0%, a difference of 0.21%), Venezuelan (2.0%, a difference of 0.35%), Immigrants from Greece (2.0%, a difference of 0.84%), and Marshallese (2.0%, a difference of 0.85%).
| Demographics | Rating | Rank | No Schooling Completed |
| Immigrants | Europe | 93.7 /100 | #125 | Exceptional 1.9% |
| Immigrants | Romania | 92.6 /100 | #126 | Exceptional 1.9% |
| Israelis | 92.4 /100 | #127 | Exceptional 1.9% |
| Spaniards | 92.3 /100 | #128 | Exceptional 1.9% |
| Seminole | 92.0 /100 | #129 | Exceptional 1.9% |
| Palestinians | 91.8 /100 | #130 | Exceptional 1.9% |
| Immigrants | Hungary | 91.6 /100 | #131 | Exceptional 1.9% |
| Colville | 90.4 /100 | #132 | Exceptional 1.9% |
| Immigrants | Turkey | 90.2 /100 | #133 | Exceptional 1.9% |
| Menominee | 89.6 /100 | #134 | Excellent 1.9% |
| Hmong | 88.5 /100 | #135 | Excellent 1.9% |
| Burmese | 88.2 /100 | #136 | Excellent 1.9% |
| Filipinos | 85.5 /100 | #137 | Excellent 2.0% |
| Immigrants | Israel | 85.4 /100 | #138 | Excellent 2.0% |
| Jordanians | 84.5 /100 | #139 | Excellent 2.0% |
| Marshallese | 83.5 /100 | #140 | Excellent 2.0% |
| Immigrants | Greece | 83.5 /100 | #141 | Excellent 2.0% |
| Venezuelans | 81.5 /100 | #142 | Excellent 2.0% |
| Immigrants | South Central Asia | 80.0 /100 | #143 | Good 2.0% |
| Alsatians | 79.1 /100 | #144 | Good 2.0% |
| Immigrants | Iran | 79.0 /100 | #145 | Good 2.0% |