Immigrants from Denmark vs Costa Rican Bachelor's Degree
COMPARE
Immigrants from Denmark
Costa Rican
Bachelor's Degree
Bachelor's Degree Comparison
Immigrants from Denmark
Costa Ricans
45.4%
BACHELOR'S DEGREE
100.0/ 100
METRIC RATING
34th/ 347
METRIC RANK
37.7%
BACHELOR'S DEGREE
47.6/ 100
METRIC RATING
176th/ 347
METRIC RANK
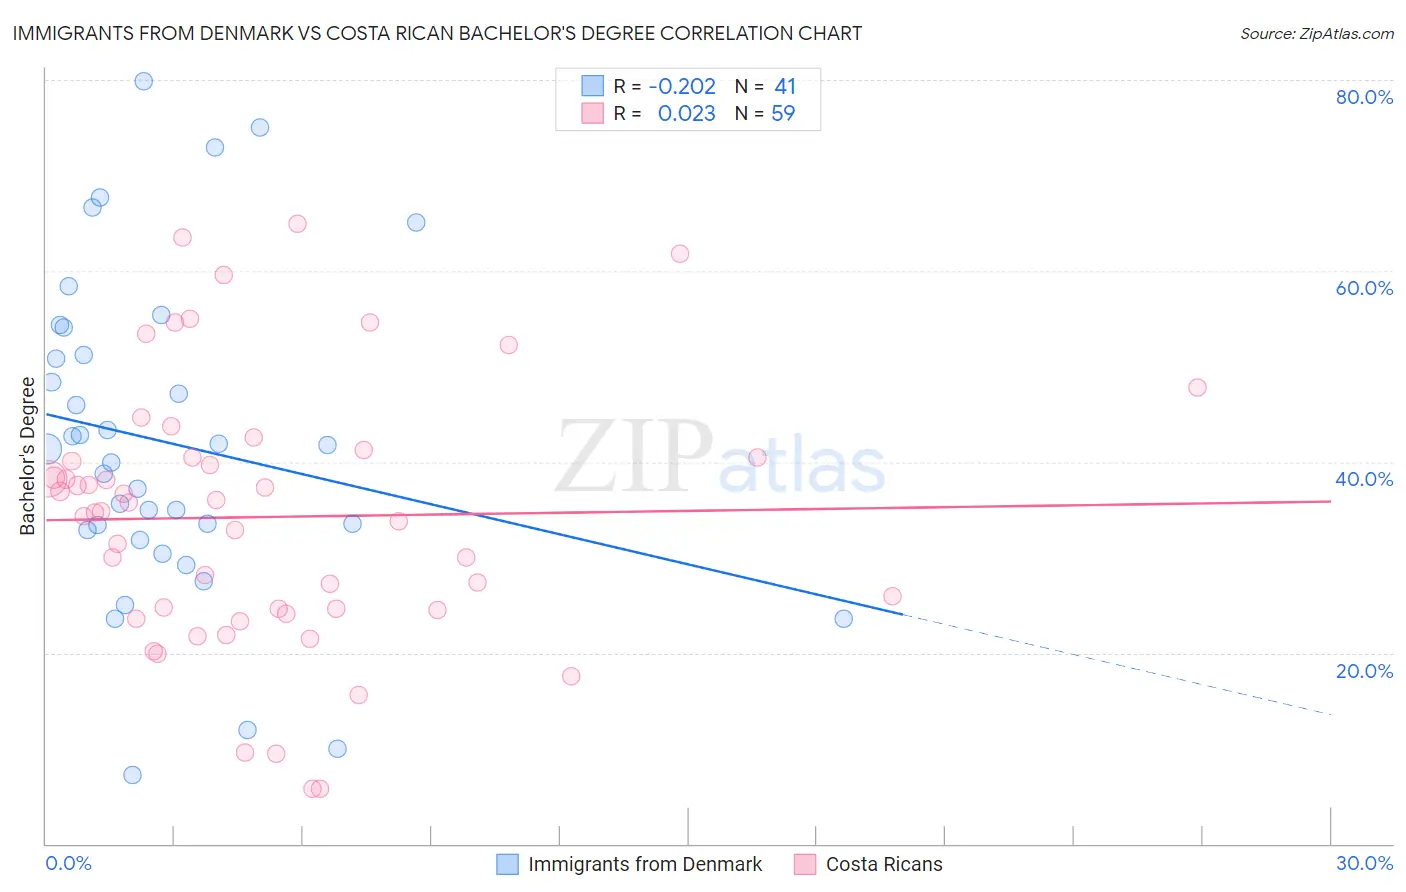
Immigrants from Denmark vs Costa Rican Bachelor's Degree Correlation Chart
The statistical analysis conducted on geographies consisting of 136,428,731 people shows a weak negative correlation between the proportion of Immigrants from Denmark and percentage of population with at least bachelor's degree education in the United States with a correlation coefficient (R) of -0.202 and weighted average of 45.4%. Similarly, the statistical analysis conducted on geographies consisting of 253,595,641 people shows no correlation between the proportion of Costa Ricans and percentage of population with at least bachelor's degree education in the United States with a correlation coefficient (R) of 0.023 and weighted average of 37.7%, a difference of 20.4%.
Bachelor's Degree Correlation Summary
| Measurement | Immigrants from Denmark | Costa Rican |
| Minimum | 7.2% | 5.7% |
| Maximum | 79.9% | 65.0% |
| Range | 72.7% | 59.3% |
| Mean | 42.0% | 34.2% |
| Median | 41.3% | 34.8% |
| Interquartile 25% (IQ1) | 32.3% | 24.5% |
| Interquartile 75% (IQ3) | 52.7% | 40.5% |
| Interquartile Range (IQR) | 20.3% | 16.0% |
| Standard Deviation (Sample) | 16.9% | 13.9% |
| Standard Deviation (Population) | 16.7% | 13.8% |
Similar Demographics by Bachelor's Degree
Demographics Similar to Immigrants from Denmark by Bachelor's Degree
In terms of bachelor's degree, the demographic groups most similar to Immigrants from Denmark are Immigrants from Russia (45.4%, a difference of 0.030%), Mongolian (45.4%, a difference of 0.040%), Russian (45.3%, a difference of 0.19%), Bulgarian (45.3%, a difference of 0.28%), and Immigrants from Northern Europe (45.6%, a difference of 0.45%).
| Demographics | Rating | Rank | Bachelor's Degree |
| Immigrants | France | 100.0 /100 | #27 | Exceptional 46.4% |
| Turks | 100.0 /100 | #28 | Exceptional 46.2% |
| Israelis | 100.0 /100 | #29 | Exceptional 46.1% |
| Immigrants | Sri Lanka | 100.0 /100 | #30 | Exceptional 46.1% |
| Latvians | 100.0 /100 | #31 | Exceptional 46.1% |
| Immigrants | Turkey | 100.0 /100 | #32 | Exceptional 46.0% |
| Immigrants | Northern Europe | 100.0 /100 | #33 | Exceptional 45.6% |
| Immigrants | Denmark | 100.0 /100 | #34 | Exceptional 45.4% |
| Immigrants | Russia | 100.0 /100 | #35 | Exceptional 45.4% |
| Mongolians | 100.0 /100 | #36 | Exceptional 45.4% |
| Russians | 100.0 /100 | #37 | Exceptional 45.3% |
| Bulgarians | 100.0 /100 | #38 | Exceptional 45.3% |
| Immigrants | Latvia | 100.0 /100 | #39 | Exceptional 45.1% |
| Immigrants | Belarus | 100.0 /100 | #40 | Exceptional 45.0% |
| Immigrants | Malaysia | 100.0 /100 | #41 | Exceptional 45.0% |
Demographics Similar to Costa Ricans by Bachelor's Degree
In terms of bachelor's degree, the demographic groups most similar to Costa Ricans are Basque (37.7%, a difference of 0.020%), Immigrants from Uruguay (37.8%, a difference of 0.080%), Immigrants from Cameroon (37.7%, a difference of 0.080%), Immigrants from Colombia (37.7%, a difference of 0.21%), and Immigrants from Bangladesh (37.8%, a difference of 0.24%).
| Demographics | Rating | Rank | Bachelor's Degree |
| Ghanaians | 55.3 /100 | #169 | Average 38.0% |
| Czechs | 54.4 /100 | #170 | Average 38.0% |
| Bermudans | 54.2 /100 | #171 | Average 38.0% |
| Immigrants | Somalia | 52.8 /100 | #172 | Average 37.9% |
| Immigrants | Iraq | 52.5 /100 | #173 | Average 37.9% |
| Immigrants | Bangladesh | 50.0 /100 | #174 | Average 37.8% |
| Immigrants | Uruguay | 48.3 /100 | #175 | Average 37.8% |
| Costa Ricans | 47.6 /100 | #176 | Average 37.7% |
| Basques | 47.4 /100 | #177 | Average 37.7% |
| Immigrants | Cameroon | 46.8 /100 | #178 | Average 37.7% |
| Immigrants | Colombia | 45.4 /100 | #179 | Average 37.7% |
| Irish | 44.3 /100 | #180 | Average 37.6% |
| Immigrants | Senegal | 43.8 /100 | #181 | Average 37.6% |
| Immigrants | Bosnia and Herzegovina | 43.4 /100 | #182 | Average 37.6% |
| Senegalese | 42.2 /100 | #183 | Average 37.5% |