Bangladeshi vs Costa Rican Bachelor's Degree
COMPARE
Bangladeshi
Costa Rican
Bachelor's Degree
Bachelor's Degree Comparison
Bangladeshis
Costa Ricans
30.2%
BACHELOR'S DEGREE
0.0/ 100
METRIC RATING
303rd/ 347
METRIC RANK
37.7%
BACHELOR'S DEGREE
47.6/ 100
METRIC RATING
176th/ 347
METRIC RANK
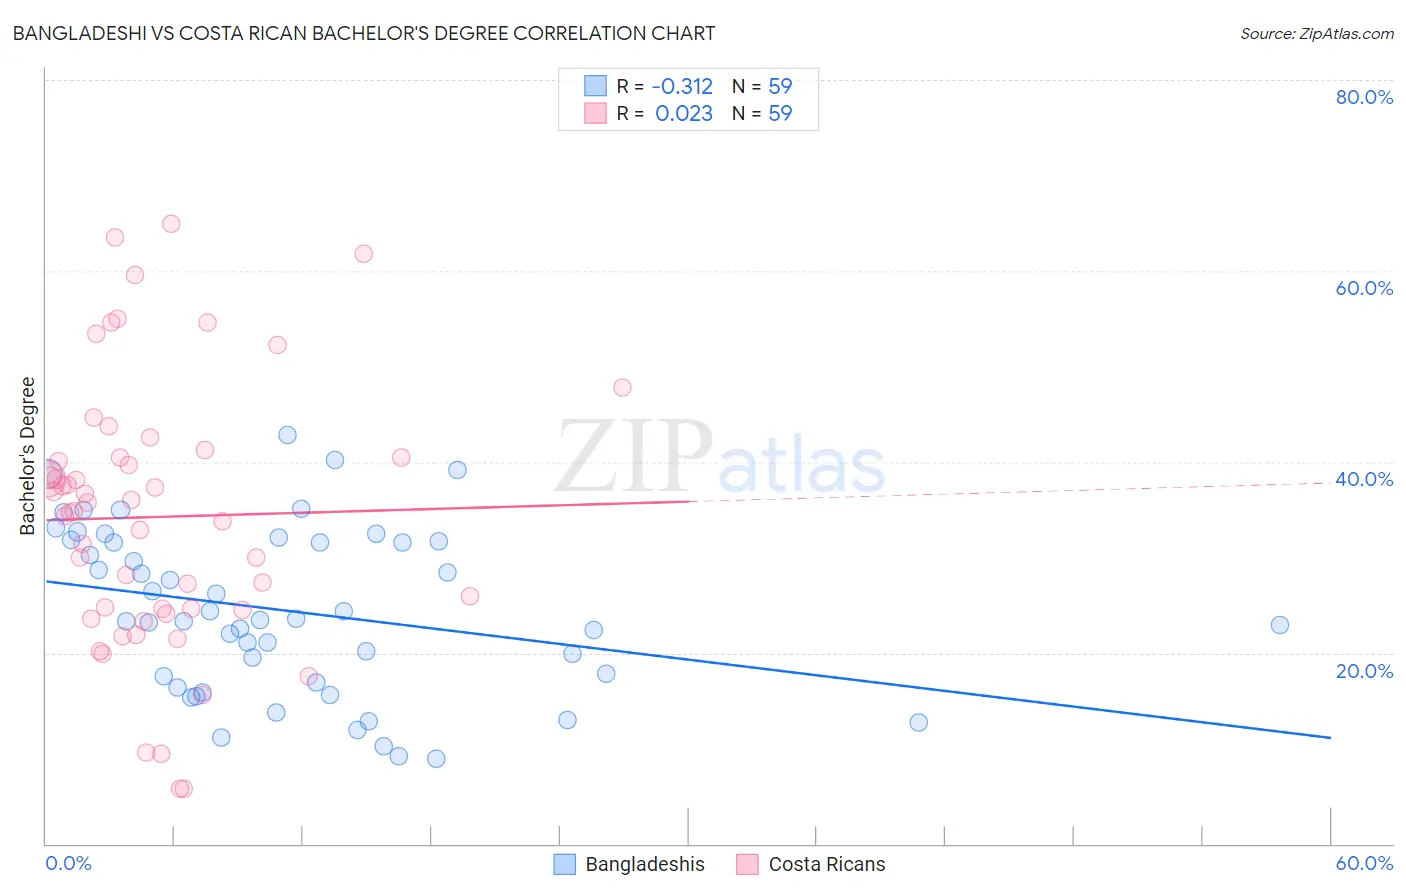
Bangladeshi vs Costa Rican Bachelor's Degree Correlation Chart
The statistical analysis conducted on geographies consisting of 141,448,336 people shows a mild negative correlation between the proportion of Bangladeshis and percentage of population with at least bachelor's degree education in the United States with a correlation coefficient (R) of -0.312 and weighted average of 30.2%. Similarly, the statistical analysis conducted on geographies consisting of 253,595,641 people shows no correlation between the proportion of Costa Ricans and percentage of population with at least bachelor's degree education in the United States with a correlation coefficient (R) of 0.023 and weighted average of 37.7%, a difference of 25.0%.
Bachelor's Degree Correlation Summary
| Measurement | Bangladeshi | Costa Rican |
| Minimum | 8.9% | 5.7% |
| Maximum | 42.8% | 65.0% |
| Range | 33.9% | 59.3% |
| Mean | 24.4% | 34.2% |
| Median | 23.4% | 34.8% |
| Interquartile 25% (IQ1) | 16.8% | 24.5% |
| Interquartile 75% (IQ3) | 31.7% | 40.5% |
| Interquartile Range (IQR) | 14.8% | 16.0% |
| Standard Deviation (Sample) | 8.6% | 13.9% |
| Standard Deviation (Population) | 8.6% | 13.8% |
Similar Demographics by Bachelor's Degree
Demographics Similar to Bangladeshis by Bachelor's Degree
In terms of bachelor's degree, the demographic groups most similar to Bangladeshis are Cherokee (30.2%, a difference of 0.010%), Mexican American Indian (30.2%, a difference of 0.17%), Immigrants from Latin America (30.1%, a difference of 0.43%), Immigrants from Cuba (30.3%, a difference of 0.45%), and Immigrants from Micronesia (30.4%, a difference of 0.66%).
| Demographics | Rating | Rank | Bachelor's Degree |
| Puget Sound Salish | 0.0 /100 | #296 | Tragic 30.7% |
| Immigrants | Haiti | 0.0 /100 | #297 | Tragic 30.6% |
| Chippewa | 0.0 /100 | #298 | Tragic 30.6% |
| Chickasaw | 0.0 /100 | #299 | Tragic 30.4% |
| Immigrants | Micronesia | 0.0 /100 | #300 | Tragic 30.4% |
| Immigrants | Cuba | 0.0 /100 | #301 | Tragic 30.3% |
| Mexican American Indians | 0.0 /100 | #302 | Tragic 30.2% |
| Bangladeshis | 0.0 /100 | #303 | Tragic 30.2% |
| Cherokee | 0.0 /100 | #304 | Tragic 30.2% |
| Immigrants | Latin America | 0.0 /100 | #305 | Tragic 30.1% |
| Immigrants | Yemen | 0.0 /100 | #306 | Tragic 29.9% |
| Nepalese | 0.0 /100 | #307 | Tragic 29.9% |
| Cajuns | 0.0 /100 | #308 | Tragic 29.6% |
| Hispanics or Latinos | 0.0 /100 | #309 | Tragic 29.6% |
| Cheyenne | 0.0 /100 | #310 | Tragic 29.4% |
Demographics Similar to Costa Ricans by Bachelor's Degree
In terms of bachelor's degree, the demographic groups most similar to Costa Ricans are Basque (37.7%, a difference of 0.020%), Immigrants from Uruguay (37.8%, a difference of 0.080%), Immigrants from Cameroon (37.7%, a difference of 0.080%), Immigrants from Colombia (37.7%, a difference of 0.21%), and Immigrants from Bangladesh (37.8%, a difference of 0.24%).
| Demographics | Rating | Rank | Bachelor's Degree |
| Ghanaians | 55.3 /100 | #169 | Average 38.0% |
| Czechs | 54.4 /100 | #170 | Average 38.0% |
| Bermudans | 54.2 /100 | #171 | Average 38.0% |
| Immigrants | Somalia | 52.8 /100 | #172 | Average 37.9% |
| Immigrants | Iraq | 52.5 /100 | #173 | Average 37.9% |
| Immigrants | Bangladesh | 50.0 /100 | #174 | Average 37.8% |
| Immigrants | Uruguay | 48.3 /100 | #175 | Average 37.8% |
| Costa Ricans | 47.6 /100 | #176 | Average 37.7% |
| Basques | 47.4 /100 | #177 | Average 37.7% |
| Immigrants | Cameroon | 46.8 /100 | #178 | Average 37.7% |
| Immigrants | Colombia | 45.4 /100 | #179 | Average 37.7% |
| Irish | 44.3 /100 | #180 | Average 37.6% |
| Immigrants | Senegal | 43.8 /100 | #181 | Average 37.6% |
| Immigrants | Bosnia and Herzegovina | 43.4 /100 | #182 | Average 37.6% |
| Senegalese | 42.2 /100 | #183 | Average 37.5% |