Scandinavian vs Canadian Master's Degree
COMPARE
Scandinavian
Canadian
Master's Degree
Master's Degree Comparison
Scandinavians
Canadians
14.4%
MASTER'S DEGREE
23.3/ 100
METRIC RATING
206th/ 347
METRIC RANK
15.7%
MASTER'S DEGREE
83.3/ 100
METRIC RATING
144th/ 347
METRIC RANK
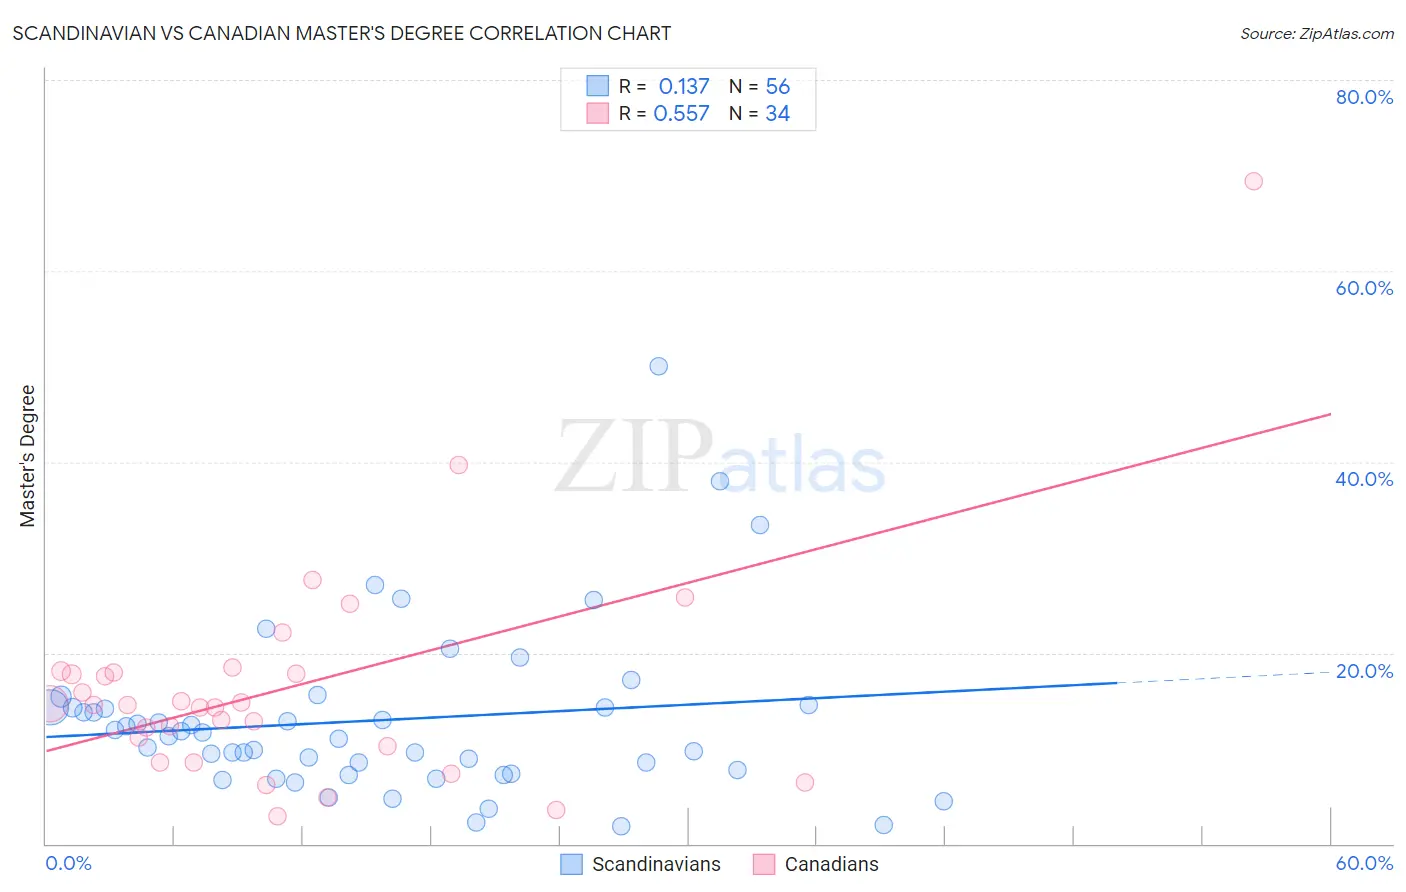
Scandinavian vs Canadian Master's Degree Correlation Chart
The statistical analysis conducted on geographies consisting of 472,399,966 people shows a poor positive correlation between the proportion of Scandinavians and percentage of population with at least master's degree education in the United States with a correlation coefficient (R) of 0.137 and weighted average of 14.4%. Similarly, the statistical analysis conducted on geographies consisting of 437,396,402 people shows a substantial positive correlation between the proportion of Canadians and percentage of population with at least master's degree education in the United States with a correlation coefficient (R) of 0.557 and weighted average of 15.7%, a difference of 9.3%.
Master's Degree Correlation Summary
| Measurement | Scandinavian | Canadian |
| Minimum | 1.8% | 2.8% |
| Maximum | 50.0% | 69.4% |
| Range | 48.2% | 66.6% |
| Mean | 12.9% | 16.3% |
| Median | 11.5% | 14.6% |
| Interquartile 25% (IQ1) | 7.5% | 10.2% |
| Interquartile 75% (IQ3) | 14.3% | 18.0% |
| Interquartile Range (IQR) | 6.8% | 7.8% |
| Standard Deviation (Sample) | 8.8% | 12.0% |
| Standard Deviation (Population) | 8.7% | 11.8% |
Similar Demographics by Master's Degree
Demographics Similar to Scandinavians by Master's Degree
In terms of master's degree, the demographic groups most similar to Scandinavians are Trinidadian and Tobagonian (14.4%, a difference of 0.040%), French (14.4%, a difference of 0.070%), Yugoslavian (14.4%, a difference of 0.18%), Immigrants from Bosnia and Herzegovina (14.3%, a difference of 0.25%), and Immigrants from Western Africa (14.4%, a difference of 0.30%).
| Demographics | Rating | Rank | Master's Degree |
| Immigrants | Armenia | 27.2 /100 | #199 | Fair 14.5% |
| Panamanians | 25.1 /100 | #200 | Fair 14.4% |
| Scotch-Irish | 25.0 /100 | #201 | Fair 14.4% |
| Immigrants | Western Africa | 24.9 /100 | #202 | Fair 14.4% |
| Yugoslavians | 24.3 /100 | #203 | Fair 14.4% |
| French | 23.7 /100 | #204 | Fair 14.4% |
| Trinidadians and Tobagonians | 23.5 /100 | #205 | Fair 14.4% |
| Scandinavians | 23.3 /100 | #206 | Fair 14.4% |
| Immigrants | Bosnia and Herzegovina | 22.0 /100 | #207 | Fair 14.3% |
| Immigrants | Barbados | 20.5 /100 | #208 | Fair 14.3% |
| Immigrants | Panama | 20.0 /100 | #209 | Fair 14.3% |
| Sub-Saharan Africans | 19.4 /100 | #210 | Poor 14.2% |
| Somalis | 18.0 /100 | #211 | Poor 14.2% |
| Spanish | 17.8 /100 | #212 | Poor 14.2% |
| Immigrants | Thailand | 17.0 /100 | #213 | Poor 14.2% |
Demographics Similar to Canadians by Master's Degree
In terms of master's degree, the demographic groups most similar to Canadians are Immigrants from Venezuela (15.7%, a difference of 0.080%), Immigrants from Africa (15.7%, a difference of 0.17%), Polish (15.7%, a difference of 0.40%), South American (15.6%, a difference of 0.42%), and Vietnamese (15.8%, a difference of 0.53%).
| Demographics | Rating | Rank | Master's Degree |
| Europeans | 86.4 /100 | #137 | Excellent 15.8% |
| Pakistanis | 86.1 /100 | #138 | Excellent 15.8% |
| Immigrants | Germany | 85.9 /100 | #139 | Excellent 15.8% |
| Vietnamese | 85.5 /100 | #140 | Excellent 15.8% |
| Poles | 85.0 /100 | #141 | Excellent 15.7% |
| Immigrants | Africa | 84.0 /100 | #142 | Excellent 15.7% |
| Immigrants | Venezuela | 83.6 /100 | #143 | Excellent 15.7% |
| Canadians | 83.3 /100 | #144 | Excellent 15.7% |
| South Americans | 81.3 /100 | #145 | Excellent 15.6% |
| Immigrants | Afghanistan | 79.4 /100 | #146 | Good 15.6% |
| Hungarians | 79.1 /100 | #147 | Good 15.6% |
| Immigrants | Senegal | 78.2 /100 | #148 | Good 15.5% |
| Ghanaians | 78.2 /100 | #149 | Good 15.5% |
| Slovenes | 78.0 /100 | #150 | Good 15.5% |
| Iraqis | 77.3 /100 | #151 | Good 15.5% |