Scottish vs Canadian Master's Degree
COMPARE
Scottish
Canadian
Master's Degree
Master's Degree Comparison
Scottish
Canadians
15.2%
MASTER'S DEGREE
62.7/ 100
METRIC RATING
169th/ 347
METRIC RANK
15.7%
MASTER'S DEGREE
83.3/ 100
METRIC RATING
144th/ 347
METRIC RANK
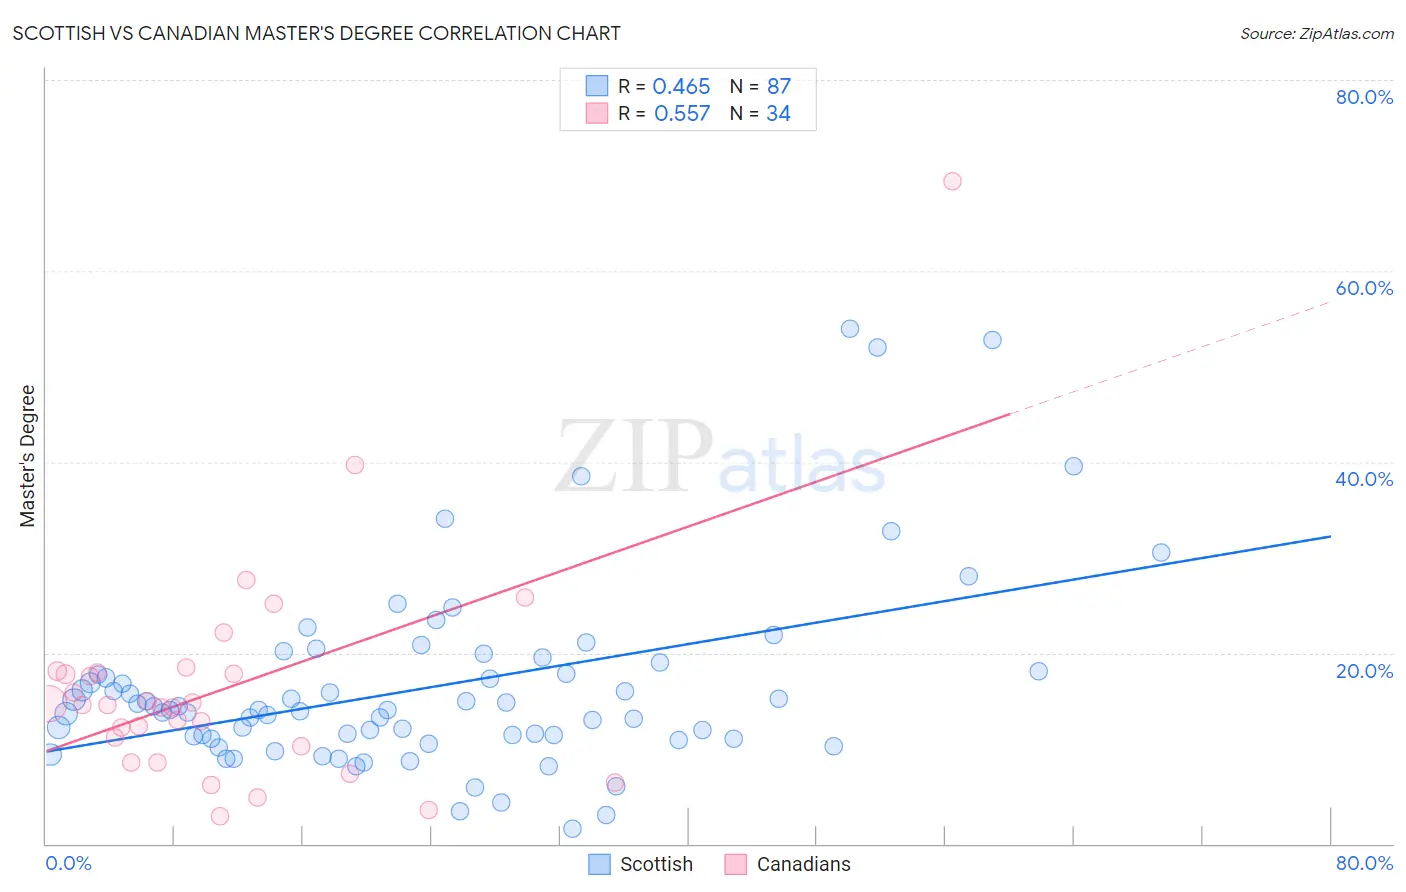
Scottish vs Canadian Master's Degree Correlation Chart
The statistical analysis conducted on geographies consisting of 566,344,578 people shows a moderate positive correlation between the proportion of Scottish and percentage of population with at least master's degree education in the United States with a correlation coefficient (R) of 0.465 and weighted average of 15.2%. Similarly, the statistical analysis conducted on geographies consisting of 437,396,402 people shows a substantial positive correlation between the proportion of Canadians and percentage of population with at least master's degree education in the United States with a correlation coefficient (R) of 0.557 and weighted average of 15.7%, a difference of 3.4%.
Master's Degree Correlation Summary
| Measurement | Scottish | Canadian |
| Minimum | 1.6% | 2.8% |
| Maximum | 54.0% | 69.4% |
| Range | 52.4% | 66.6% |
| Mean | 16.4% | 16.3% |
| Median | 14.0% | 14.6% |
| Interquartile 25% (IQ1) | 11.1% | 10.2% |
| Interquartile 75% (IQ3) | 18.0% | 18.0% |
| Interquartile Range (IQR) | 7.0% | 7.8% |
| Standard Deviation (Sample) | 9.9% | 12.0% |
| Standard Deviation (Population) | 9.8% | 11.8% |
Similar Demographics by Master's Degree
Demographics Similar to Scottish by Master's Degree
In terms of master's degree, the demographic groups most similar to Scottish are Immigrants from North Macedonia (15.2%, a difference of 0.25%), Senegalese (15.2%, a difference of 0.39%), Swedish (15.2%, a difference of 0.46%), Immigrants from Kenya (15.3%, a difference of 0.54%), and Colombian (15.3%, a difference of 0.58%).
| Demographics | Rating | Rank | Master's Degree |
| Peruvians | 68.7 /100 | #162 | Good 15.3% |
| Uruguayans | 67.1 /100 | #163 | Good 15.3% |
| Colombians | 66.9 /100 | #164 | Good 15.3% |
| Immigrants | Kenya | 66.6 /100 | #165 | Good 15.3% |
| Swedes | 66.1 /100 | #166 | Good 15.2% |
| Senegalese | 65.6 /100 | #167 | Good 15.2% |
| Immigrants | North Macedonia | 64.5 /100 | #168 | Good 15.2% |
| Scottish | 62.7 /100 | #169 | Good 15.2% |
| Irish | 56.3 /100 | #170 | Average 15.0% |
| Immigrants | Ghana | 53.6 /100 | #171 | Average 15.0% |
| Immigrants | Uruguay | 52.8 /100 | #172 | Average 15.0% |
| Costa Ricans | 52.5 /100 | #173 | Average 15.0% |
| Slovaks | 50.0 /100 | #174 | Average 14.9% |
| Immigrants | Peru | 49.6 /100 | #175 | Average 14.9% |
| Nigerians | 48.6 /100 | #176 | Average 14.9% |
Demographics Similar to Canadians by Master's Degree
In terms of master's degree, the demographic groups most similar to Canadians are Immigrants from Venezuela (15.7%, a difference of 0.080%), Immigrants from Africa (15.7%, a difference of 0.17%), Polish (15.7%, a difference of 0.40%), South American (15.6%, a difference of 0.42%), and Vietnamese (15.8%, a difference of 0.53%).
| Demographics | Rating | Rank | Master's Degree |
| Europeans | 86.4 /100 | #137 | Excellent 15.8% |
| Pakistanis | 86.1 /100 | #138 | Excellent 15.8% |
| Immigrants | Germany | 85.9 /100 | #139 | Excellent 15.8% |
| Vietnamese | 85.5 /100 | #140 | Excellent 15.8% |
| Poles | 85.0 /100 | #141 | Excellent 15.7% |
| Immigrants | Africa | 84.0 /100 | #142 | Excellent 15.7% |
| Immigrants | Venezuela | 83.6 /100 | #143 | Excellent 15.7% |
| Canadians | 83.3 /100 | #144 | Excellent 15.7% |
| South Americans | 81.3 /100 | #145 | Excellent 15.6% |
| Immigrants | Afghanistan | 79.4 /100 | #146 | Good 15.6% |
| Hungarians | 79.1 /100 | #147 | Good 15.6% |
| Immigrants | Senegal | 78.2 /100 | #148 | Good 15.5% |
| Ghanaians | 78.2 /100 | #149 | Good 15.5% |
| Slovenes | 78.0 /100 | #150 | Good 15.5% |
| Iraqis | 77.3 /100 | #151 | Good 15.5% |