South American vs Puget Sound Salish Householder Income Ages 45 - 64 years
COMPARE
South American
Puget Sound Salish
Householder Income Ages 45 - 64 years
Householder Income Ages 45 - 64 years Comparison
South Americans
Puget Sound Salish
$100,837
HOUSEHOLDER INCOME AGES 45 - 64 YEARS
56.4/ 100
METRIC RATING
171st/ 347
METRIC RANK
$98,340
HOUSEHOLDER INCOME AGES 45 - 64 YEARS
27.0/ 100
METRIC RATING
197th/ 347
METRIC RANK
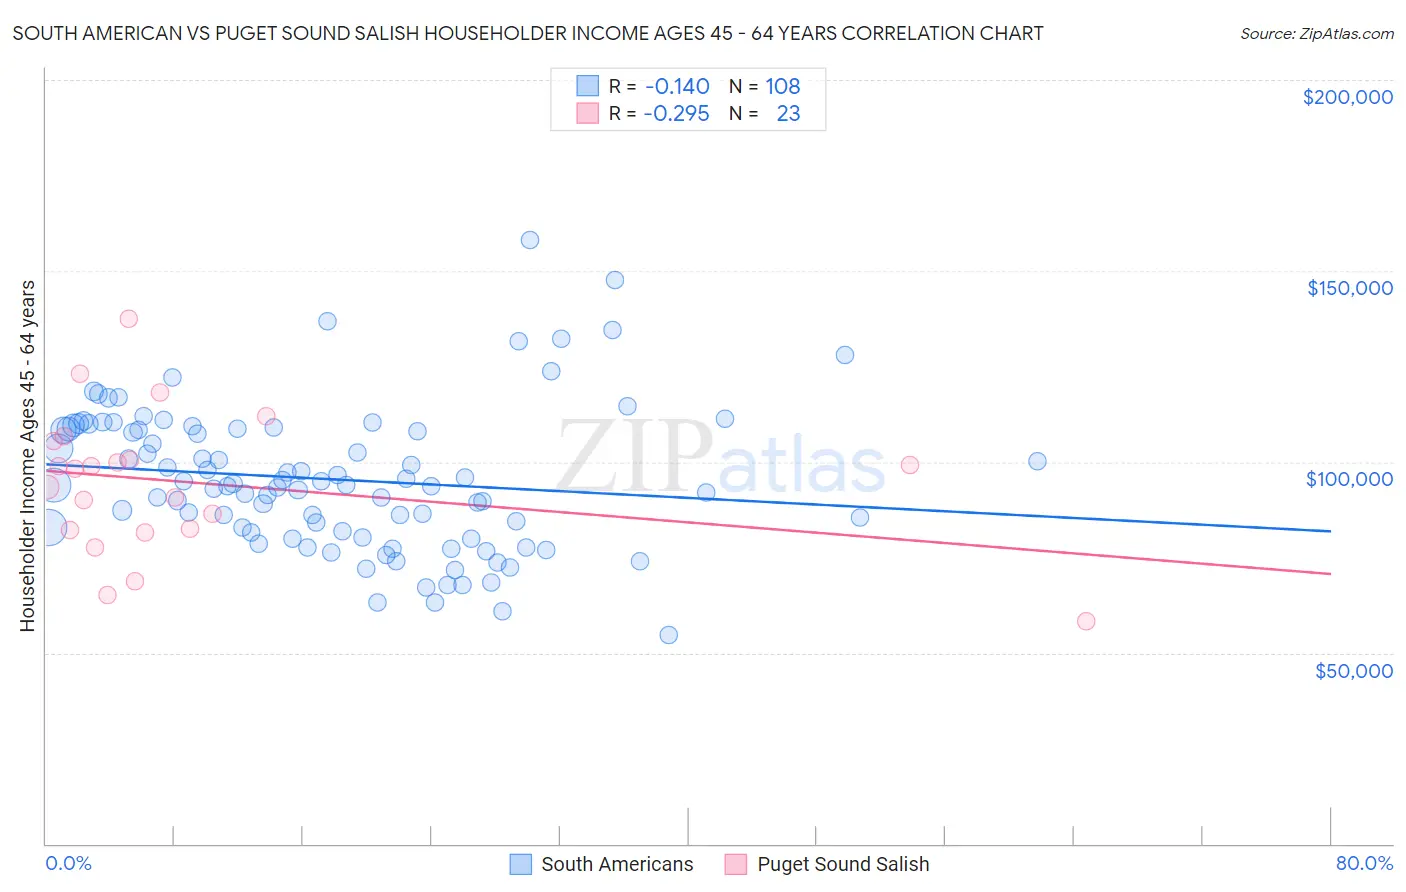
South American vs Puget Sound Salish Householder Income Ages 45 - 64 years Correlation Chart
The statistical analysis conducted on geographies consisting of 492,624,098 people shows a poor negative correlation between the proportion of South Americans and household income with householder between the ages 45 and 64 in the United States with a correlation coefficient (R) of -0.140 and weighted average of $100,837. Similarly, the statistical analysis conducted on geographies consisting of 46,126,240 people shows a weak negative correlation between the proportion of Puget Sound Salish and household income with householder between the ages 45 and 64 in the United States with a correlation coefficient (R) of -0.295 and weighted average of $98,340, a difference of 2.5%.
Householder Income Ages 45 - 64 years Correlation Summary
| Measurement | South American | Puget Sound Salish |
| Minimum | $54,659 | $58,333 |
| Maximum | $158,009 | $137,604 |
| Range | $103,350 | $79,271 |
| Mean | $95,419 | $94,554 |
| Median | $93,921 | $98,357 |
| Interquartile 25% (IQ1) | $81,601 | $82,172 |
| Interquartile 75% (IQ3) | $108,663 | $105,339 |
| Interquartile Range (IQR) | $27,062 | $23,167 |
| Standard Deviation (Sample) | $18,909 | $18,602 |
| Standard Deviation (Population) | $18,822 | $18,193 |
Similar Demographics by Householder Income Ages 45 - 64 years
Demographics Similar to South Americans by Householder Income Ages 45 - 64 years
In terms of householder income ages 45 - 64 years, the demographic groups most similar to South Americans are Slovak ($101,029, a difference of 0.19%), Immigrants from Uzbekistan ($100,523, a difference of 0.31%), South American Indian ($101,171, a difference of 0.33%), Guamanian/Chamorro ($101,170, a difference of 0.33%), and Alsatian ($100,435, a difference of 0.40%).
| Demographics | Rating | Rank | Householder Income Ages 45 - 64 years |
| Immigrants | Morocco | 70.0 /100 | #164 | Good $102,015 |
| Immigrants | Albania | 69.4 /100 | #165 | Good $101,957 |
| Samoans | 65.3 /100 | #166 | Good $101,580 |
| Czechoslovakians | 63.0 /100 | #167 | Good $101,387 |
| South American Indians | 60.5 /100 | #168 | Good $101,171 |
| Guamanians/Chamorros | 60.5 /100 | #169 | Good $101,170 |
| Slovaks | 58.8 /100 | #170 | Average $101,029 |
| South Americans | 56.4 /100 | #171 | Average $100,837 |
| Immigrants | Uzbekistan | 52.5 /100 | #172 | Average $100,523 |
| Alsatians | 51.4 /100 | #173 | Average $100,435 |
| Welsh | 50.0 /100 | #174 | Average $100,322 |
| Germans | 48.8 /100 | #175 | Average $100,224 |
| Immigrants | Costa Rica | 47.7 /100 | #176 | Average $100,141 |
| Moroccans | 47.7 /100 | #177 | Average $100,138 |
| Immigrants | Cameroon | 47.0 /100 | #178 | Average $100,084 |
Demographics Similar to Puget Sound Salish by Householder Income Ages 45 - 64 years
In terms of householder income ages 45 - 64 years, the demographic groups most similar to Puget Sound Salish are Immigrants from Eastern Africa ($98,467, a difference of 0.13%), Immigrants from Iraq ($98,201, a difference of 0.14%), Spanish ($98,554, a difference of 0.22%), White/Caucasian ($98,091, a difference of 0.25%), and Uruguayan ($98,660, a difference of 0.32%).
| Demographics | Rating | Rank | Householder Income Ages 45 - 64 years |
| French Canadians | 35.1 /100 | #190 | Fair $99,093 |
| Kenyans | 33.7 /100 | #191 | Fair $98,970 |
| Celtics | 32.9 /100 | #192 | Fair $98,896 |
| Hawaiians | 31.6 /100 | #193 | Fair $98,778 |
| Uruguayans | 30.3 /100 | #194 | Fair $98,660 |
| Spanish | 29.2 /100 | #195 | Fair $98,554 |
| Immigrants | Eastern Africa | 28.3 /100 | #196 | Fair $98,467 |
| Puget Sound Salish | 27.0 /100 | #197 | Fair $98,340 |
| Immigrants | Iraq | 25.7 /100 | #198 | Fair $98,201 |
| Whites/Caucasians | 24.6 /100 | #199 | Fair $98,091 |
| Immigrants | Kenya | 23.5 /100 | #200 | Fair $97,964 |
| Yugoslavians | 20.0 /100 | #201 | Fair $97,558 |
| Tlingit-Haida | 18.9 /100 | #202 | Poor $97,417 |
| Immigrants | Thailand | 18.8 /100 | #203 | Poor $97,400 |
| Immigrants | Eritrea | 18.6 /100 | #204 | Poor $97,373 |