South American Indian vs Immigrants from Czechoslovakia 1st Grade
COMPARE
South American Indian
Immigrants from Czechoslovakia
1st Grade
1st Grade Comparison
South American Indians
Immigrants from Czechoslovakia
97.7%
1ST GRADE
7.6/ 100
METRIC RATING
214th/ 347
METRIC RANK
98.2%
1ST GRADE
96.6/ 100
METRIC RATING
111th/ 347
METRIC RANK
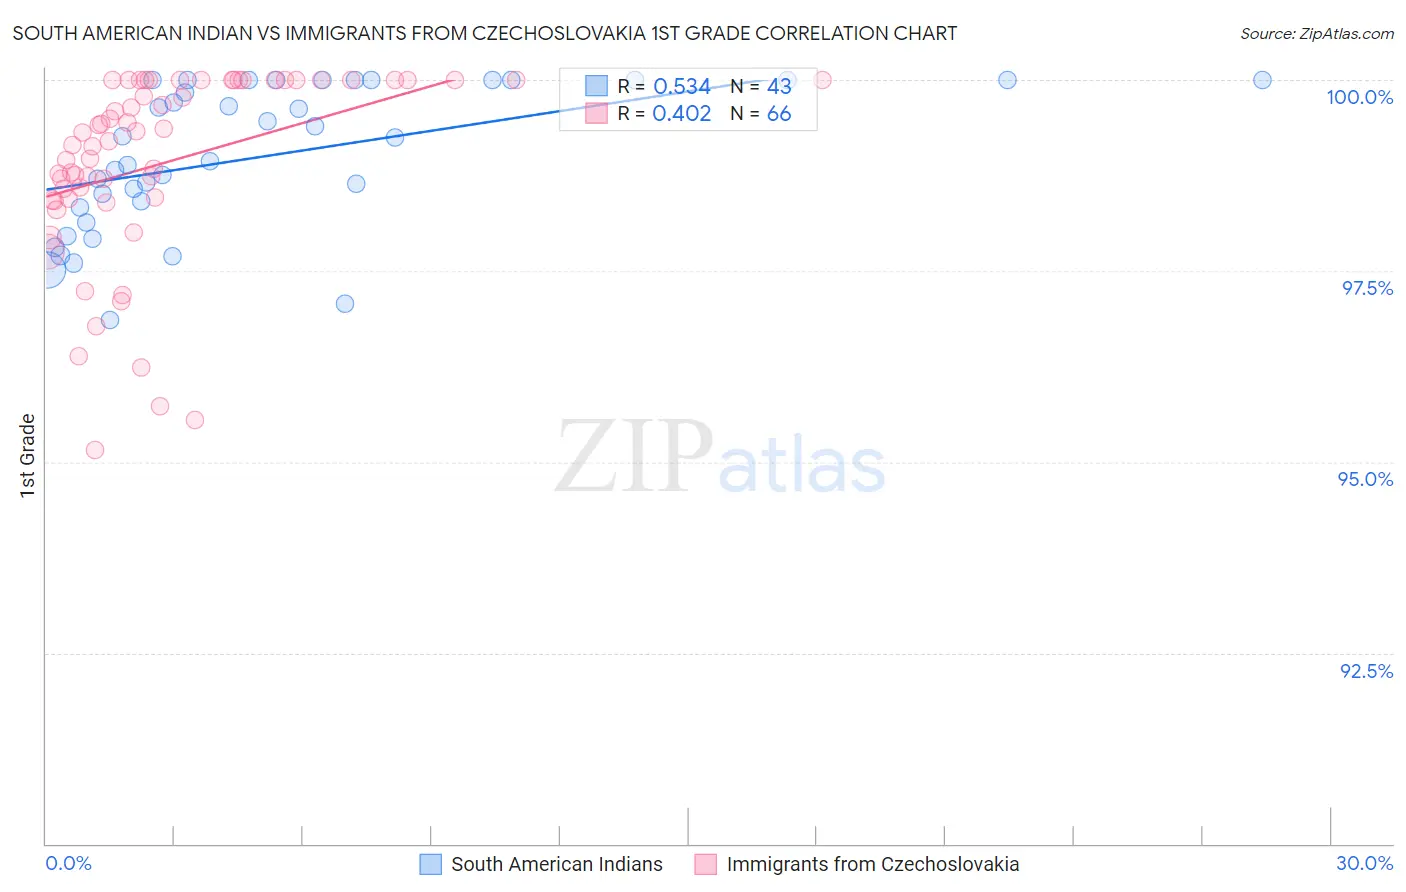
South American Indian vs Immigrants from Czechoslovakia 1st Grade Correlation Chart
The statistical analysis conducted on geographies consisting of 164,573,401 people shows a substantial positive correlation between the proportion of South American Indians and percentage of population with at least 1st grade education in the United States with a correlation coefficient (R) of 0.534 and weighted average of 97.7%. Similarly, the statistical analysis conducted on geographies consisting of 195,448,060 people shows a moderate positive correlation between the proportion of Immigrants from Czechoslovakia and percentage of population with at least 1st grade education in the United States with a correlation coefficient (R) of 0.402 and weighted average of 98.2%, a difference of 0.46%.
1st Grade Correlation Summary
| Measurement | South American Indian | Immigrants from Czechoslovakia |
| Minimum | 96.9% | 95.2% |
| Maximum | 100.0% | 100.0% |
| Range | 3.1% | 4.8% |
| Mean | 99.0% | 98.9% |
| Median | 99.2% | 99.3% |
| Interquartile 25% (IQ1) | 98.3% | 98.4% |
| Interquartile 75% (IQ3) | 100.0% | 100.0% |
| Interquartile Range (IQR) | 1.7% | 1.6% |
| Standard Deviation (Sample) | 0.95% | 1.2% |
| Standard Deviation (Population) | 0.94% | 1.2% |
Similar Demographics by 1st Grade
Demographics Similar to South American Indians by 1st Grade
In terms of 1st grade, the demographic groups most similar to South American Indians are Bahamian (97.7%, a difference of 0.0%), Uruguayan (97.7%, a difference of 0.0%), Moroccan (97.7%, a difference of 0.010%), Immigrants from Bahamas (97.7%, a difference of 0.010%), and Samoan (97.7%, a difference of 0.010%).
| Demographics | Rating | Rank | 1st Grade |
| Africans | 16.5 /100 | #207 | Poor 97.8% |
| Immigrants | Northern Africa | 12.0 /100 | #208 | Poor 97.8% |
| Costa Ricans | 11.6 /100 | #209 | Poor 97.8% |
| Immigrants | Oceania | 11.0 /100 | #210 | Poor 97.8% |
| Laotians | 10.3 /100 | #211 | Poor 97.8% |
| Moroccans | 8.7 /100 | #212 | Tragic 97.7% |
| Immigrants | Bahamas | 8.1 /100 | #213 | Tragic 97.7% |
| South American Indians | 7.6 /100 | #214 | Tragic 97.7% |
| Bahamians | 7.5 /100 | #215 | Tragic 97.7% |
| Uruguayans | 7.4 /100 | #216 | Tragic 97.7% |
| Samoans | 6.8 /100 | #217 | Tragic 97.7% |
| Immigrants | Morocco | 5.3 /100 | #218 | Tragic 97.7% |
| Immigrants | Panama | 5.2 /100 | #219 | Tragic 97.7% |
| Tongans | 4.6 /100 | #220 | Tragic 97.7% |
| Immigrants | Sudan | 4.3 /100 | #221 | Tragic 97.7% |
Demographics Similar to Immigrants from Czechoslovakia by 1st Grade
In terms of 1st grade, the demographic groups most similar to Immigrants from Czechoslovakia are Immigrants from Singapore (98.2%, a difference of 0.0%), Immigrants from Norway (98.2%, a difference of 0.0%), German Russian (98.2%, a difference of 0.010%), Immigrants from Latvia (98.2%, a difference of 0.010%), and Ute (98.2%, a difference of 0.010%).
| Demographics | Rating | Rank | 1st Grade |
| Pima | 97.5 /100 | #104 | Exceptional 98.2% |
| Basques | 97.4 /100 | #105 | Exceptional 98.2% |
| Turks | 97.4 /100 | #106 | Exceptional 98.2% |
| Immigrants | Switzerland | 97.3 /100 | #107 | Exceptional 98.2% |
| Bhutanese | 97.3 /100 | #108 | Exceptional 98.2% |
| German Russians | 97.1 /100 | #109 | Exceptional 98.2% |
| Immigrants | Singapore | 96.7 /100 | #110 | Exceptional 98.2% |
| Immigrants | Czechoslovakia | 96.6 /100 | #111 | Exceptional 98.2% |
| Immigrants | Norway | 96.6 /100 | #112 | Exceptional 98.2% |
| Immigrants | Latvia | 96.4 /100 | #113 | Exceptional 98.2% |
| Ute | 96.2 /100 | #114 | Exceptional 98.2% |
| Iranians | 96.0 /100 | #115 | Exceptional 98.2% |
| Spanish | 95.9 /100 | #116 | Exceptional 98.2% |
| Yugoslavians | 95.5 /100 | #117 | Exceptional 98.2% |
| Immigrants | France | 95.5 /100 | #118 | Exceptional 98.2% |