South African vs Hungarian 1 or more Vehicles in Household
COMPARE
South African
Hungarian
1 or more Vehicles in Household
1 or more Vehicles in Household Comparison
South Africans
Hungarians
90.0%
1 OR MORE VEHICLES IN HOUSEHOLD
69.7/ 100
METRIC RATING
159th/ 347
METRIC RANK
90.3%
1 OR MORE VEHICLES IN HOUSEHOLD
86.5/ 100
METRIC RATING
136th/ 347
METRIC RANK
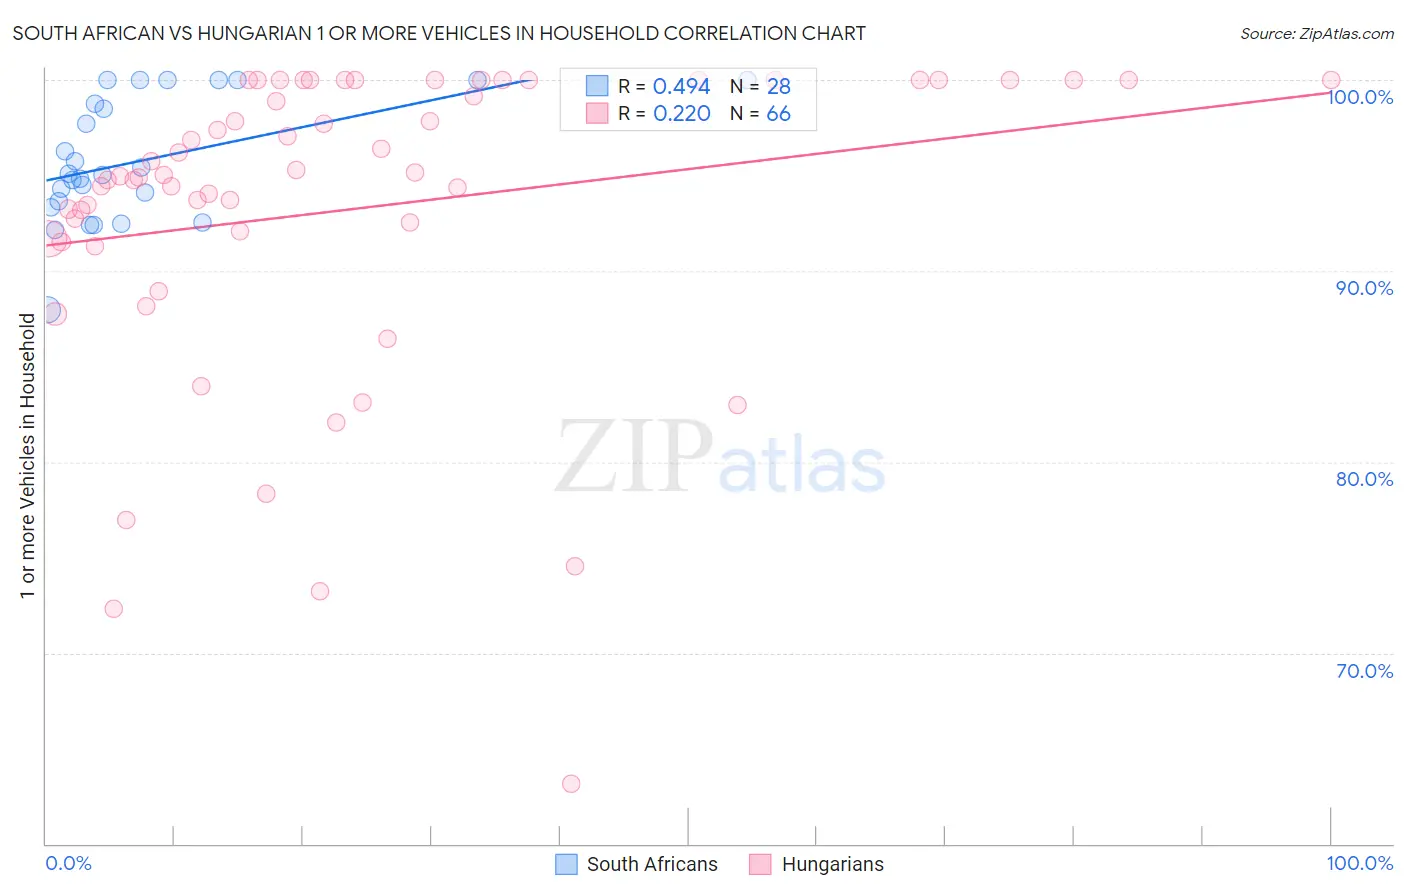
South African vs Hungarian 1 or more Vehicles in Household Correlation Chart
The statistical analysis conducted on geographies consisting of 182,559,953 people shows a moderate positive correlation between the proportion of South Africans and percentage of households with 1 or more vehicles available in the United States with a correlation coefficient (R) of 0.494 and weighted average of 90.0%. Similarly, the statistical analysis conducted on geographies consisting of 485,902,681 people shows a weak positive correlation between the proportion of Hungarians and percentage of households with 1 or more vehicles available in the United States with a correlation coefficient (R) of 0.220 and weighted average of 90.3%, a difference of 0.40%.
1 or more Vehicles in Household Correlation Summary
| Measurement | South African | Hungarian |
| Minimum | 88.0% | 63.1% |
| Maximum | 100.0% | 100.0% |
| Range | 12.0% | 36.9% |
| Mean | 95.8% | 93.2% |
| Median | 95.1% | 95.0% |
| Interquartile 25% (IQ1) | 93.5% | 91.7% |
| Interquartile 75% (IQ3) | 99.4% | 100.0% |
| Interquartile Range (IQR) | 5.9% | 8.3% |
| Standard Deviation (Sample) | 3.2% | 8.1% |
| Standard Deviation (Population) | 3.2% | 8.0% |
Similar Demographics by 1 or more Vehicles in Household
Demographics Similar to South Africans by 1 or more Vehicles in Household
In terms of 1 or more vehicles in household, the demographic groups most similar to South Africans are Brazilian (90.0%, a difference of 0.020%), Immigrants from Indonesia (90.0%, a difference of 0.020%), Salvadoran (90.0%, a difference of 0.020%), Immigrants from Congo (90.0%, a difference of 0.030%), and Australian (90.0%, a difference of 0.050%).
| Demographics | Rating | Rank | 1 or more Vehicles in Household |
| Tlingit-Haida | 74.3 /100 | #152 | Good 90.1% |
| New Zealanders | 73.8 /100 | #153 | Good 90.1% |
| Immigrants | Uganda | 73.8 /100 | #154 | Good 90.1% |
| Immigrants | Immigrants | 73.6 /100 | #155 | Good 90.1% |
| Australians | 72.4 /100 | #156 | Good 90.0% |
| Immigrants | Congo | 71.2 /100 | #157 | Good 90.0% |
| Brazilians | 71.0 /100 | #158 | Good 90.0% |
| South Africans | 69.7 /100 | #159 | Good 90.0% |
| Immigrants | Indonesia | 68.8 /100 | #160 | Good 90.0% |
| Salvadorans | 68.7 /100 | #161 | Good 90.0% |
| Spanish American Indians | 67.0 /100 | #162 | Good 89.9% |
| Immigrants | Austria | 65.5 /100 | #163 | Good 89.9% |
| Comanche | 63.4 /100 | #164 | Good 89.9% |
| Immigrants | Saudi Arabia | 62.6 /100 | #165 | Good 89.9% |
| Immigrants | Middle Africa | 62.2 /100 | #166 | Good 89.9% |
Demographics Similar to Hungarians by 1 or more Vehicles in Household
In terms of 1 or more vehicles in household, the demographic groups most similar to Hungarians are Latvian (90.3%, a difference of 0.010%), Syrian (90.3%, a difference of 0.010%), Kenyan (90.4%, a difference of 0.020%), Immigrants from Oceania (90.4%, a difference of 0.020%), and Estonian (90.3%, a difference of 0.030%).
| Demographics | Rating | Rank | 1 or more Vehicles in Household |
| Marshallese | 88.9 /100 | #129 | Excellent 90.4% |
| Nicaraguans | 88.8 /100 | #130 | Excellent 90.4% |
| Immigrants | Kenya | 88.5 /100 | #131 | Excellent 90.4% |
| Immigrants | South Africa | 88.1 /100 | #132 | Excellent 90.4% |
| Immigrants | Syria | 87.5 /100 | #133 | Excellent 90.4% |
| Kenyans | 87.0 /100 | #134 | Excellent 90.4% |
| Immigrants | Oceania | 86.9 /100 | #135 | Excellent 90.4% |
| Hungarians | 86.5 /100 | #136 | Excellent 90.3% |
| Latvians | 86.3 /100 | #137 | Excellent 90.3% |
| Syrians | 86.3 /100 | #138 | Excellent 90.3% |
| Estonians | 85.6 /100 | #139 | Excellent 90.3% |
| Sudanese | 85.2 /100 | #140 | Excellent 90.3% |
| Immigrants | Moldova | 83.1 /100 | #141 | Excellent 90.2% |
| Immigrants | Lithuania | 83.0 /100 | #142 | Excellent 90.2% |
| Immigrants | Bahamas | 81.5 /100 | #143 | Excellent 90.2% |