Somali vs Immigrants from Nigeria No Schooling Completed
COMPARE
Somali
Immigrants from Nigeria
No Schooling Completed
No Schooling Completed Comparison
Somalis
Immigrants from Nigeria
2.9%
NO SCHOOLING COMPLETED
0.0/ 100
METRIC RATING
303rd/ 347
METRIC RANK
2.5%
NO SCHOOLING COMPLETED
0.2/ 100
METRIC RATING
269th/ 347
METRIC RANK
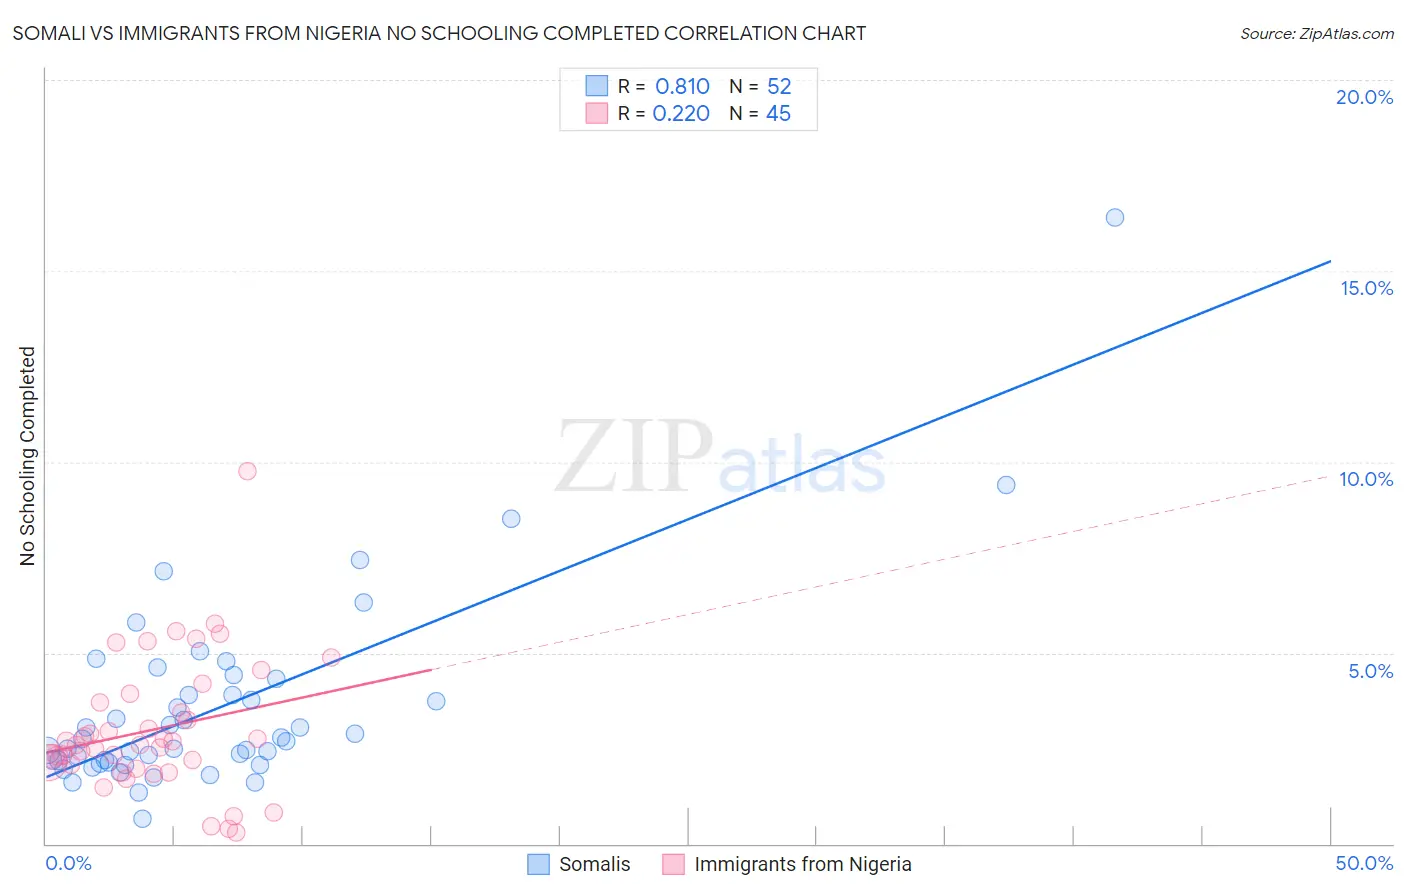
Somali vs Immigrants from Nigeria No Schooling Completed Correlation Chart
The statistical analysis conducted on geographies consisting of 99,157,968 people shows a very strong positive correlation between the proportion of Somalis and percentage of population with no schooling in the United States with a correlation coefficient (R) of 0.810 and weighted average of 2.9%. Similarly, the statistical analysis conducted on geographies consisting of 282,263,250 people shows a weak positive correlation between the proportion of Immigrants from Nigeria and percentage of population with no schooling in the United States with a correlation coefficient (R) of 0.220 and weighted average of 2.5%, a difference of 16.8%.
No Schooling Completed Correlation Summary
| Measurement | Somali | Immigrants from Nigeria |
| Minimum | 0.66% | 0.30% |
| Maximum | 16.4% | 9.7% |
| Range | 15.8% | 9.4% |
| Mean | 3.6% | 3.0% |
| Median | 2.7% | 2.6% |
| Interquartile 25% (IQ1) | 2.2% | 2.0% |
| Interquartile 75% (IQ3) | 4.1% | 3.8% |
| Interquartile Range (IQR) | 2.0% | 1.8% |
| Standard Deviation (Sample) | 2.6% | 1.8% |
| Standard Deviation (Population) | 2.5% | 1.7% |
Similar Demographics by No Schooling Completed
Demographics Similar to Somalis by No Schooling Completed
In terms of no schooling completed, the demographic groups most similar to Somalis are Nicaraguan (2.9%, a difference of 0.19%), Ecuadorian (3.0%, a difference of 0.66%), Immigrants from Caribbean (2.9%, a difference of 0.99%), Immigrants from South Eastern Asia (2.9%, a difference of 1.4%), and Belizean (3.0%, a difference of 2.3%).
| Demographics | Rating | Rank | No Schooling Completed |
| Immigrants | Immigrants | 0.0 /100 | #296 | Tragic 2.8% |
| Immigrants | Cuba | 0.0 /100 | #297 | Tragic 2.8% |
| Immigrants | Dominica | 0.0 /100 | #298 | Tragic 2.8% |
| Central American Indians | 0.0 /100 | #299 | Tragic 2.8% |
| Haitians | 0.0 /100 | #300 | Tragic 2.9% |
| Immigrants | South Eastern Asia | 0.0 /100 | #301 | Tragic 2.9% |
| Immigrants | Caribbean | 0.0 /100 | #302 | Tragic 2.9% |
| Somalis | 0.0 /100 | #303 | Tragic 2.9% |
| Nicaraguans | 0.0 /100 | #304 | Tragic 2.9% |
| Ecuadorians | 0.0 /100 | #305 | Tragic 3.0% |
| Belizeans | 0.0 /100 | #306 | Tragic 3.0% |
| Immigrants | Haiti | 0.0 /100 | #307 | Tragic 3.0% |
| Immigrants | Somalia | 0.0 /100 | #308 | Tragic 3.0% |
| Hispanics or Latinos | 0.0 /100 | #309 | Tragic 3.0% |
| Guyanese | 0.0 /100 | #310 | Tragic 3.0% |
Demographics Similar to Immigrants from Nigeria by No Schooling Completed
In terms of no schooling completed, the demographic groups most similar to Immigrants from Nigeria are Immigrants from Peru (2.5%, a difference of 0.080%), Cuban (2.5%, a difference of 0.090%), Immigrants from Bolivia (2.5%, a difference of 0.62%), Taiwanese (2.5%, a difference of 0.86%), and Yuman (2.5%, a difference of 1.1%).
| Demographics | Rating | Rank | No Schooling Completed |
| Immigrants | Sierra Leone | 0.5 /100 | #262 | Tragic 2.5% |
| Immigrants | Liberia | 0.4 /100 | #263 | Tragic 2.5% |
| Indians (Asian) | 0.4 /100 | #264 | Tragic 2.5% |
| West Indians | 0.4 /100 | #265 | Tragic 2.5% |
| Fijians | 0.4 /100 | #266 | Tragic 2.5% |
| Yuman | 0.4 /100 | #267 | Tragic 2.5% |
| Taiwanese | 0.3 /100 | #268 | Tragic 2.5% |
| Immigrants | Nigeria | 0.2 /100 | #269 | Tragic 2.5% |
| Immigrants | Peru | 0.2 /100 | #270 | Tragic 2.5% |
| Cubans | 0.2 /100 | #271 | Tragic 2.5% |
| Immigrants | Bolivia | 0.2 /100 | #272 | Tragic 2.5% |
| Immigrants | Cameroon | 0.1 /100 | #273 | Tragic 2.5% |
| Ghanaians | 0.1 /100 | #274 | Tragic 2.6% |
| Immigrants | China | 0.1 /100 | #275 | Tragic 2.6% |
| Immigrants | Western Africa | 0.1 /100 | #276 | Tragic 2.6% |