Somali vs Zimbabwean No Schooling Completed

COMPARE

Somali
Race
Ancestry
AfghanAfricanAlaska NativeAlaskan AthabascanAlbanianAleutAlsatianAmericanApacheArabArapahoArgentineanArmenianAssyrian/Chaldean/SyriacAustralianAustrianBahamianBangladeshiBarbadianBasqueBelgianBelizeanBermudanBhutaneseBlackfeetBolivianBrazilianBritishBritish West IndianBulgarianBurmeseCajunCambodianCanadianCape VerdeanCarpatho RusynCelticCentral AmericanCentral American IndianCherokeeCheyenneChickasawChileanChineseChippewaChoctawColombianColvilleComancheCosta RicanCreeCreekCroatianCrowCubanCypriotCzechCzechoslovakianDanishDelawareDominicanDutchDutch West IndianEastern EuropeanEcuadorianEgyptianEnglishEstonianEthiopianEuropeanFijianFilipinoFinnishFrenchFrench American IndianFrench CanadianGermanGerman RussianGhanaianGreekGuamanian/ChamorroGuatemalanGuyaneseHaitianHmongHonduranHopiHoumaHungarianIcelanderIndian (Asian)IndonesianInupiatIranianIraqiIrishIroquoisIsraeliItalianJamaicanJapaneseJordanianKenyanKiowaKoreanLaotianLatvianLebaneseLiberianLithuanianLumbeeLuxembourgerMacedonianMalaysianMalteseMarshalleseMenomineeMexicanMexican American IndianMongolianMoroccanNative HawaiianNavajoNepaleseNew ZealanderNicaraguanNigerianNorthern EuropeanNorwegianOkinawanOsageOttawaPaiutePakistaniPalestinianPanamanianParaguayanPennsylvania GermanPeruvianPimaPolishPortuguesePotawatomiPuebloPuerto RicanPuget Sound SalishRomanianRussianSalvadoranSamoanScandinavianScotch-IrishScottishSeminoleSenegaleseSerbianShoshoneSierra LeoneanSiouxSlavicSlovakSloveneSomaliSouth AfricanSouth AmericanSouth American IndianSoviet UnionSpaniardSpanishSpanish AmericanSpanish American IndianSri LankanSubsaharan AfricanSudaneseSwedishSwissSyrianTaiwaneseThaiTlingit-HaidaTohono O'OdhamTonganTrinidadian and TobagonianTsimshianTurkishU.S. Virgin IslanderUgandanUkrainianUruguayanUteVenezuelanVietnameseWelshWest IndianYakamaYaquiYugoslavianYumanYup'ik
Immigration
NonimmigrantsImmigrantsAfghanistanAfricaAlbaniaArgentinaArmeniaAsiaAustraliaAustriaBahamasBangladeshBarbadosBelarusBelgiumBelizeBoliviaBosnia and HerzegovinaBrazilBulgariaBurma/MyanmarCabo VerdeCambodiaCameroonCanadaCaribbeanCentral AmericaChileChinaColombiaCongoCosta RicaCroatiaCubaCzechoslovakiaDenmarkDominicaDominican RepublicEastern AfricaEastern AsiaEastern EuropeEcuadorEgyptEl SalvadorEnglandEritreaEthiopiaEuropeFijiFranceGermanyGhanaGreeceGrenadaGuatemalaGuyanaHaitiHondurasHong KongHungaryIndiaIndonesiaIranIraqIrelandIsraelItalyJamaicaJapanJordanKazakhstanKenyaKoreaKuwaitLaosLatin AmericaLatviaLebanonLiberiaLithuaniaMalaysiaMexicoMicronesiaMiddle AfricaMoldovaMoroccoNepalNetherlandsNicaraguaNigeriaNorth AmericaNorth MacedoniaNorthern AfricaNorthern EuropeNorwayOceaniaPakistanPanamaPeruPhilippinesPolandPortugalRomaniaRussiaSaudi ArabiaScotlandSenegalSerbiaSierra LeoneSingaporeSomaliaSouth AfricaSouth AmericaSouth Central AsiaSouth Eastern AsiaSouthern EuropeSpainSri LankaSt. Vincent and the GrenadinesSudanSwedenSwitzerlandSyriaTaiwanThailandTrinidad and TobagoTurkeyUgandaUkraineUruguayUzbekistanVenezuelaVietnamWest IndiesWestern AfricaWestern AsiaWestern EuropeYemenZaireZimbabweAzores
Zimbabwean
Race
Ancestry
AfghanAfricanAlaska NativeAlaskan AthabascanAlbanianAleutAlsatianAmericanApacheArabArapahoArgentineanArmenianAssyrian/Chaldean/SyriacAustralianAustrianBahamianBangladeshiBarbadianBasqueBelgianBelizeanBermudanBhutaneseBlackfeetBolivianBrazilianBritishBritish West IndianBulgarianBurmeseCajunCambodianCanadianCape VerdeanCarpatho RusynCelticCentral AmericanCentral American IndianCherokeeCheyenneChickasawChileanChineseChippewaChoctawColombianColvilleComancheCosta RicanCreeCreekCroatianCrowCubanCypriotCzechCzechoslovakianDanishDelawareDominicanDutchDutch West IndianEastern EuropeanEcuadorianEgyptianEnglishEstonianEthiopianEuropeanFijianFilipinoFinnishFrenchFrench American IndianFrench CanadianGermanGerman RussianGhanaianGreekGuamanian/ChamorroGuatemalanGuyaneseHaitianHmongHonduranHopiHoumaHungarianIcelanderIndian (Asian)IndonesianInupiatIranianIraqiIrishIroquoisIsraeliItalianJamaicanJapaneseJordanianKenyanKiowaKoreanLaotianLatvianLebaneseLiberianLithuanianLumbeeLuxembourgerMacedonianMalaysianMalteseMarshalleseMenomineeMexicanMexican American IndianMongolianMoroccanNative HawaiianNavajoNepaleseNew ZealanderNicaraguanNigerianNorthern EuropeanNorwegianOkinawanOsageOttawaPaiutePakistaniPalestinianPanamanianParaguayanPennsylvania GermanPeruvianPimaPolishPortuguesePotawatomiPuebloPuerto RicanPuget Sound SalishRomanianRussianSalvadoranSamoanScandinavianScotch-IrishScottishSeminoleSenegaleseSerbianShoshoneSierra LeoneanSiouxSlavicSlovakSloveneSouth AfricanSouth AmericanSouth American IndianSoviet UnionSpaniardSpanishSpanish AmericanSpanish American IndianSri LankanSubsaharan AfricanSudaneseSwedishSwissSyrianTaiwaneseThaiTlingit-HaidaTohono O'OdhamTonganTrinidadian and TobagonianTsimshianTurkishU.S. Virgin IslanderUgandanUkrainianUruguayanUteVenezuelanVietnameseWelshWest IndianYakamaYaquiYugoslavianYumanYup'ikZimbabwean
Immigration
NonimmigrantsImmigrantsAfghanistanAfricaAlbaniaArgentinaArmeniaAsiaAustraliaAustriaBahamasBangladeshBarbadosBelarusBelgiumBelizeBoliviaBosnia and HerzegovinaBrazilBulgariaBurma/MyanmarCabo VerdeCambodiaCameroonCanadaCaribbeanCentral AmericaChileChinaColombiaCongoCosta RicaCroatiaCubaCzechoslovakiaDenmarkDominicaDominican RepublicEastern AfricaEastern AsiaEastern EuropeEcuadorEgyptEl SalvadorEnglandEritreaEthiopiaEuropeFijiFranceGermanyGhanaGreeceGrenadaGuatemalaGuyanaHaitiHondurasHong KongHungaryIndiaIndonesiaIranIraqIrelandIsraelItalyJamaicaJapanJordanKazakhstanKenyaKoreaKuwaitLaosLatin AmericaLatviaLebanonLiberiaLithuaniaMalaysiaMexicoMicronesiaMiddle AfricaMoldovaMoroccoNepalNetherlandsNicaraguaNigeriaNorth AmericaNorth MacedoniaNorthern AfricaNorthern EuropeNorwayOceaniaPakistanPanamaPeruPhilippinesPolandPortugalRomaniaRussiaSaudi ArabiaScotlandSenegalSerbiaSierra LeoneSingaporeSomaliaSouth AfricaSouth AmericaSouth Central AsiaSouth Eastern AsiaSouthern EuropeSpainSri LankaSt. Vincent and the GrenadinesSudanSwedenSwitzerlandSyriaTaiwanThailandTrinidad and TobagoTurkeyUgandaUkraineUruguayUzbekistanVenezuelaVietnamWest IndiesWestern AfricaWestern AsiaWestern EuropeYemenZaireZimbabweAzores
No Schooling Completed
Income
Poverty
Unemployment
Labor Participation
Family Structure
Vehicle Availability
Education Level
Disability

No Schooling Completed Comparison

Somalis

Zimbabweans

Tragic
Exceptional
2.9%
NO SCHOOLING COMPLETED
0.0/ 100
METRIC RATING
303rd/ 347
METRIC RANK
1.7%
NO SCHOOLING COMPLETED
99.4/ 100
METRIC RATING
74th/ 347
METRIC RANK

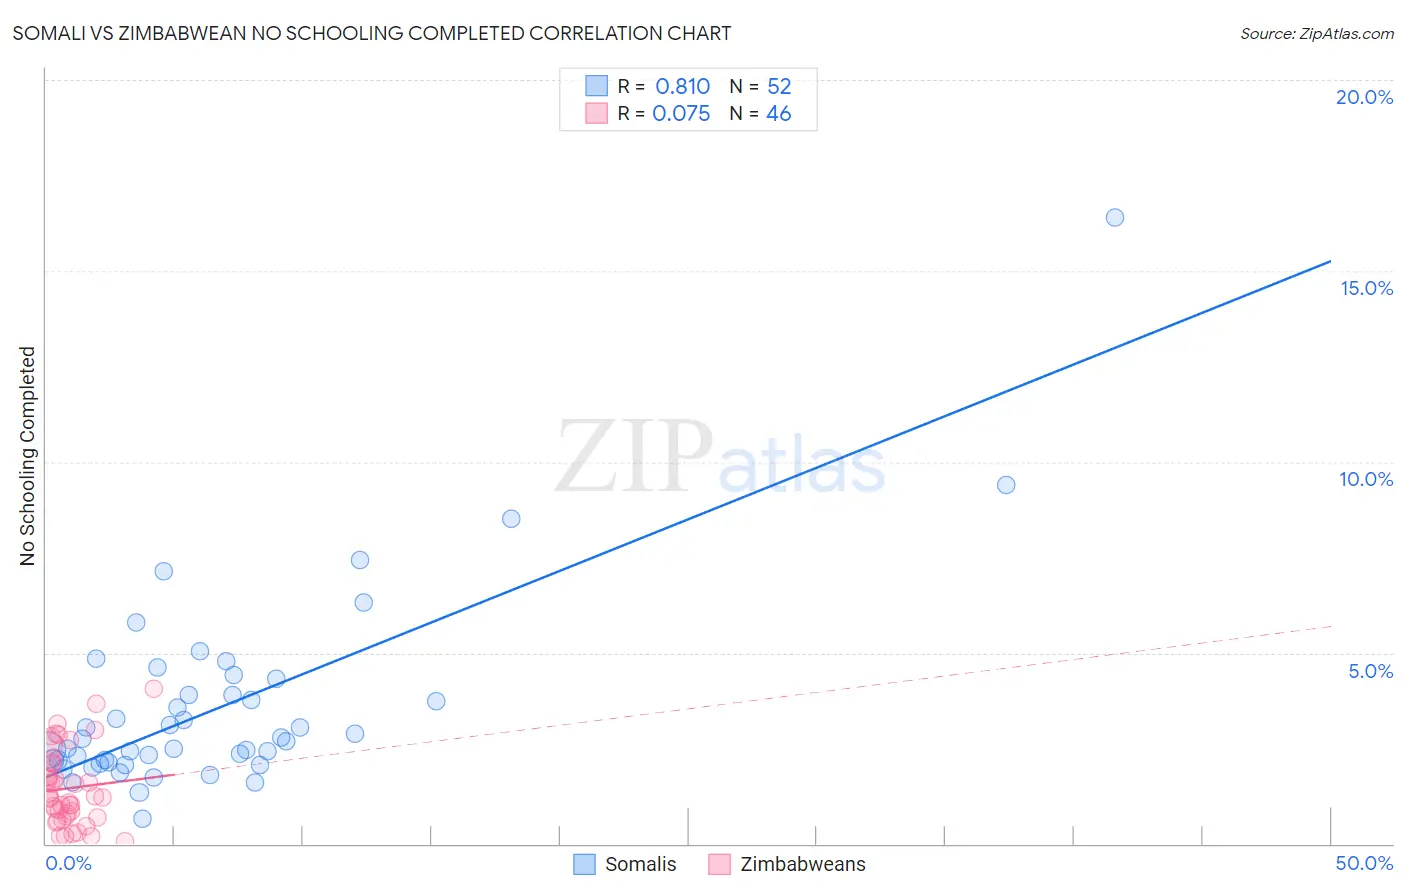
Somali vs Zimbabwean No Schooling Completed Correlation Chart

The statistical analysis conducted on geographies consisting of 99,157,968 people shows a very strong positive correlation between the proportion of Somalis and percentage of population with no schooling in the United States with a correlation coefficient (R) of 0.810 and weighted average of 2.9%. Similarly, the statistical analysis conducted on geographies consisting of 69,120,863 people shows a slight positive correlation between the proportion of Zimbabweans and percentage of population with no schooling in the United States with a correlation coefficient (R) of 0.075 and weighted average of 1.7%, a difference of 69.9%.
Somali vs Zimbabwean No Schooling Completed

No Schooling Completed Correlation Summary

MeasurementSomaliZimbabwean
Minimum0.66%0.063%
Maximum16.4%4.1%
Range15.8%4.0%
Mean3.6%1.5%
Median2.7%1.2%
Interquartile 25% (IQ1)2.2%0.71%
Interquartile 75% (IQ3)4.1%2.1%
Interquartile Range (IQR)2.0%1.4%
Standard Deviation (Sample)2.6%0.99%
Standard Deviation (Population)2.5%0.98%

Similar Demographics by No Schooling Completed

Demographics Similar to Somalis by No Schooling Completed

In terms of no schooling completed, the demographic groups most similar to Somalis are Nicaraguan (2.9%, a difference of 0.19%), Ecuadorian (3.0%, a difference of 0.66%), Immigrants from Caribbean (2.9%, a difference of 0.99%), Immigrants from South Eastern Asia (2.9%, a difference of 1.4%), and Belizean (3.0%, a difference of 2.3%).
DemographicsRating | RankNo Schooling Completed
Immigrants | Immigrants
0.0
/100
|
#296
Tragic
2.8%
Immigrants | Cuba
0.0
/100
|
#297
Tragic
2.8%
Immigrants | Dominica
0.0
/100
|
#298
Tragic
2.8%
Central American Indians
0.0
/100
|
#299
Tragic
2.8%
Haitians
0.0
/100
|
#300
Tragic
2.9%
Immigrants | South Eastern Asia
0.0
/100
|
#301
Tragic
2.9%
Immigrants | Caribbean
0.0
/100
|
#302
Tragic
2.9%
Somalis
0.0
/100
|
#303
Tragic
2.9%
Nicaraguans
0.0
/100
|
#304
Tragic
2.9%
Ecuadorians
0.0
/100
|
#305
Tragic
3.0%
Belizeans
0.0
/100
|
#306
Tragic
3.0%
Immigrants | Haiti
0.0
/100
|
#307
Tragic
3.0%
Immigrants | Somalia
0.0
/100
|
#308
Tragic
3.0%
Hispanics or Latinos
0.0
/100
|
#309
Tragic
3.0%
Guyanese
0.0
/100
|
#310
Tragic
3.0%

Demographics Similar to Zimbabweans by No Schooling Completed

In terms of no schooling completed, the demographic groups most similar to Zimbabweans are Immigrants from India (1.7%, a difference of 0.020%), Cajun (1.7%, a difference of 0.50%), Immigrants from Belgium (1.7%, a difference of 0.58%), Cherokee (1.7%, a difference of 0.63%), and Immigrants from England (1.7%, a difference of 0.68%).
DemographicsRating | RankNo Schooling Completed
Immigrants | Austria
99.7
/100
|
#67
Exceptional
1.7%
Immigrants | Lithuania
99.7
/100
|
#68
Exceptional
1.7%
Chickasaw
99.6
/100
|
#69
Exceptional
1.7%
Immigrants | Netherlands
99.6
/100
|
#70
Exceptional
1.7%
Immigrants | England
99.5
/100
|
#71
Exceptional
1.7%
Cajuns
99.5
/100
|
#72
Exceptional
1.7%
Immigrants | India
99.4
/100
|
#73
Exceptional
1.7%
Zimbabweans
99.4
/100
|
#74
Exceptional
1.7%
Immigrants | Belgium
99.3
/100
|
#75
Exceptional
1.7%
Cherokee
99.3
/100
|
#76
Exceptional
1.7%
Immigrants | Sweden
99.3
/100
|
#77
Exceptional
1.7%
Delaware
99.3
/100
|
#78
Exceptional
1.7%
Macedonians
99.3
/100
|
#79
Exceptional
1.7%
Cypriots
99.3
/100
|
#80
Exceptional
1.7%
Icelanders
99.3
/100
|
#81
Exceptional
1.7%