Hopi vs Immigrants from Nigeria No Schooling Completed
COMPARE
Hopi
Immigrants from Nigeria
No Schooling Completed
No Schooling Completed Comparison
Hopi
Immigrants from Nigeria
2.2%
NO SCHOOLING COMPLETED
12.9/ 100
METRIC RATING
204th/ 347
METRIC RANK
2.5%
NO SCHOOLING COMPLETED
0.2/ 100
METRIC RATING
269th/ 347
METRIC RANK
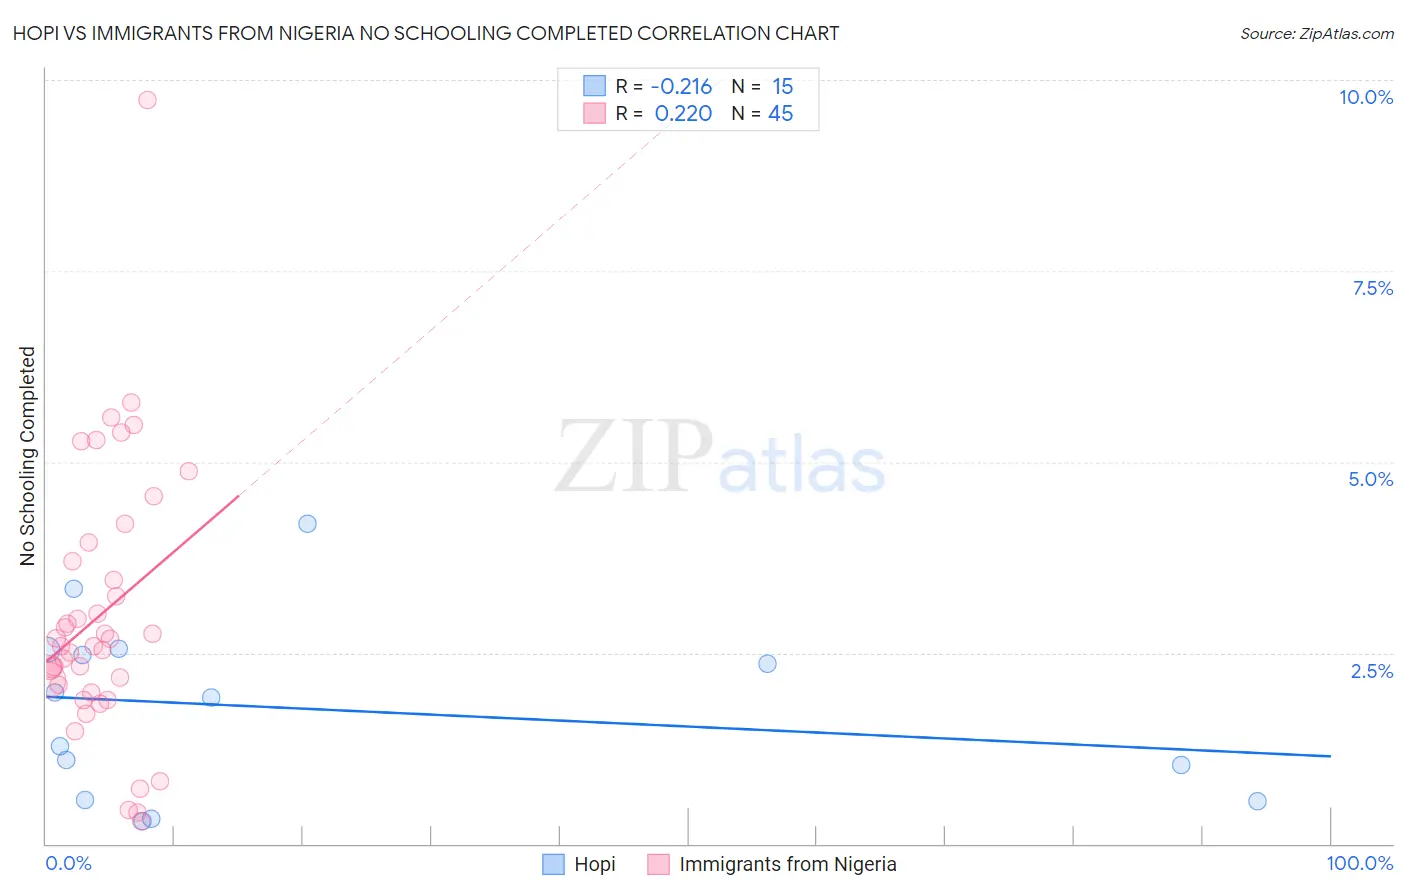
Hopi vs Immigrants from Nigeria No Schooling Completed Correlation Chart
The statistical analysis conducted on geographies consisting of 74,568,063 people shows a weak negative correlation between the proportion of Hopi and percentage of population with no schooling in the United States with a correlation coefficient (R) of -0.216 and weighted average of 2.2%. Similarly, the statistical analysis conducted on geographies consisting of 282,263,250 people shows a weak positive correlation between the proportion of Immigrants from Nigeria and percentage of population with no schooling in the United States with a correlation coefficient (R) of 0.220 and weighted average of 2.5%, a difference of 12.9%.
No Schooling Completed Correlation Summary
| Measurement | Hopi | Immigrants from Nigeria |
| Minimum | 0.29% | 0.30% |
| Maximum | 4.2% | 9.7% |
| Range | 3.9% | 9.4% |
| Mean | 1.8% | 3.0% |
| Median | 1.9% | 2.6% |
| Interquartile 25% (IQ1) | 0.57% | 2.0% |
| Interquartile 75% (IQ3) | 2.5% | 3.8% |
| Interquartile Range (IQR) | 2.0% | 1.8% |
| Standard Deviation (Sample) | 1.2% | 1.8% |
| Standard Deviation (Population) | 1.1% | 1.7% |
Similar Demographics by No Schooling Completed
Demographics Similar to Hopi by No Schooling Completed
In terms of no schooling completed, the demographic groups most similar to Hopi are Laotian (2.2%, a difference of 0.11%), Moroccan (2.2%, a difference of 0.22%), Immigrants from Bahamas (2.2%, a difference of 0.40%), Bahamian (2.2%, a difference of 0.41%), and South American Indian (2.2%, a difference of 0.59%).
| Demographics | Rating | Rank | No Schooling Completed |
| Immigrants | Southern Europe | 23.8 /100 | #197 | Fair 2.2% |
| Immigrants | Chile | 22.7 /100 | #198 | Fair 2.2% |
| Africans | 21.8 /100 | #199 | Fair 2.2% |
| Immigrants | Northern Africa | 19.5 /100 | #200 | Poor 2.2% |
| Costa Ricans | 17.1 /100 | #201 | Poor 2.2% |
| Moroccans | 13.7 /100 | #202 | Poor 2.2% |
| Laotians | 13.3 /100 | #203 | Poor 2.2% |
| Hopi | 12.9 /100 | #204 | Poor 2.2% |
| Immigrants | Bahamas | 11.6 /100 | #205 | Poor 2.2% |
| Bahamians | 11.6 /100 | #206 | Poor 2.2% |
| South American Indians | 11.0 /100 | #207 | Poor 2.2% |
| Uruguayans | 11.0 /100 | #208 | Poor 2.2% |
| Immigrants | Oceania | 10.2 /100 | #209 | Poor 2.2% |
| Natives/Alaskans | 10.0 /100 | #210 | Tragic 2.2% |
| Immigrants | Panama | 8.8 /100 | #211 | Tragic 2.3% |
Demographics Similar to Immigrants from Nigeria by No Schooling Completed
In terms of no schooling completed, the demographic groups most similar to Immigrants from Nigeria are Immigrants from Peru (2.5%, a difference of 0.080%), Cuban (2.5%, a difference of 0.090%), Immigrants from Bolivia (2.5%, a difference of 0.62%), Taiwanese (2.5%, a difference of 0.86%), and Yuman (2.5%, a difference of 1.1%).
| Demographics | Rating | Rank | No Schooling Completed |
| Immigrants | Sierra Leone | 0.5 /100 | #262 | Tragic 2.5% |
| Immigrants | Liberia | 0.4 /100 | #263 | Tragic 2.5% |
| Indians (Asian) | 0.4 /100 | #264 | Tragic 2.5% |
| West Indians | 0.4 /100 | #265 | Tragic 2.5% |
| Fijians | 0.4 /100 | #266 | Tragic 2.5% |
| Yuman | 0.4 /100 | #267 | Tragic 2.5% |
| Taiwanese | 0.3 /100 | #268 | Tragic 2.5% |
| Immigrants | Nigeria | 0.2 /100 | #269 | Tragic 2.5% |
| Immigrants | Peru | 0.2 /100 | #270 | Tragic 2.5% |
| Cubans | 0.2 /100 | #271 | Tragic 2.5% |
| Immigrants | Bolivia | 0.2 /100 | #272 | Tragic 2.5% |
| Immigrants | Cameroon | 0.1 /100 | #273 | Tragic 2.5% |
| Ghanaians | 0.1 /100 | #274 | Tragic 2.6% |
| Immigrants | China | 0.1 /100 | #275 | Tragic 2.6% |
| Immigrants | Western Africa | 0.1 /100 | #276 | Tragic 2.6% |