Somali vs Immigrants from Trinidad and Tobago No Schooling Completed
COMPARE
Somali
Immigrants from Trinidad and Tobago
No Schooling Completed
No Schooling Completed Comparison
Somalis
Immigrants from Trinidad and Tobago
2.9%
NO SCHOOLING COMPLETED
0.0/ 100
METRIC RATING
303rd/ 347
METRIC RANK
2.6%
NO SCHOOLING COMPLETED
0.0/ 100
METRIC RATING
283rd/ 347
METRIC RANK
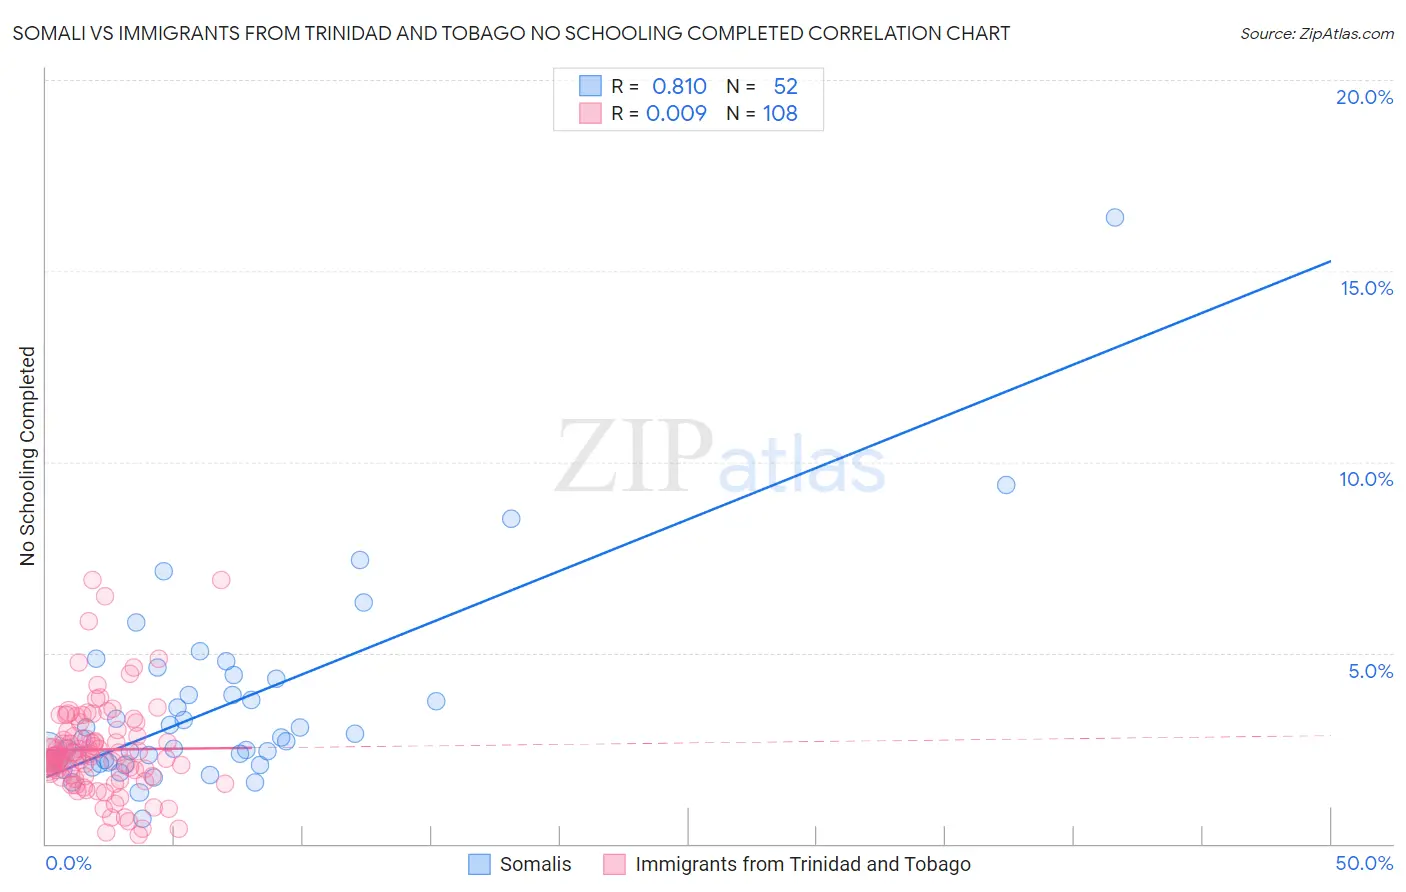
Somali vs Immigrants from Trinidad and Tobago No Schooling Completed Correlation Chart
The statistical analysis conducted on geographies consisting of 99,157,968 people shows a very strong positive correlation between the proportion of Somalis and percentage of population with no schooling in the United States with a correlation coefficient (R) of 0.810 and weighted average of 2.9%. Similarly, the statistical analysis conducted on geographies consisting of 222,835,417 people shows no correlation between the proportion of Immigrants from Trinidad and Tobago and percentage of population with no schooling in the United States with a correlation coefficient (R) of 0.009 and weighted average of 2.6%, a difference of 11.4%.
No Schooling Completed Correlation Summary
| Measurement | Somali | Immigrants from Trinidad and Tobago |
| Minimum | 0.66% | 0.21% |
| Maximum | 16.4% | 6.9% |
| Range | 15.8% | 6.7% |
| Mean | 3.6% | 2.5% |
| Median | 2.7% | 2.3% |
| Interquartile 25% (IQ1) | 2.2% | 1.8% |
| Interquartile 75% (IQ3) | 4.1% | 2.9% |
| Interquartile Range (IQR) | 2.0% | 1.1% |
| Standard Deviation (Sample) | 2.6% | 1.2% |
| Standard Deviation (Population) | 2.5% | 1.2% |
Demographics Similar to Somalis and Immigrants from Trinidad and Tobago by No Schooling Completed
In terms of no schooling completed, the demographic groups most similar to Somalis are Immigrants from Caribbean (2.9%, a difference of 0.99%), Immigrants from South Eastern Asia (2.9%, a difference of 1.4%), Haitian (2.9%, a difference of 2.9%), Central American Indian (2.8%, a difference of 3.2%), and Immigrants from Dominica (2.8%, a difference of 3.7%). Similarly, the demographic groups most similar to Immigrants from Trinidad and Tobago are Immigrants from West Indies (2.7%, a difference of 0.72%), Immigrants from Barbados (2.7%, a difference of 0.80%), Immigrants from Portugal (2.7%, a difference of 1.2%), Immigrants from Afghanistan (2.7%, a difference of 2.0%), and Immigrants from St. Vincent and the Grenadines (2.7%, a difference of 2.1%).
| Demographics | Rating | Rank | No Schooling Completed |
| Immigrants | Trinidad and Tobago | 0.0 /100 | #283 | Tragic 2.6% |
| Immigrants | West Indies | 0.0 /100 | #284 | Tragic 2.7% |
| Immigrants | Barbados | 0.0 /100 | #285 | Tragic 2.7% |
| Immigrants | Portugal | 0.0 /100 | #286 | Tragic 2.7% |
| Immigrants | Afghanistan | 0.0 /100 | #287 | Tragic 2.7% |
| Immigrants | St. Vincent and the Grenadines | 0.0 /100 | #288 | Tragic 2.7% |
| Immigrants | Thailand | 0.0 /100 | #289 | Tragic 2.7% |
| Immigrants | Hong Kong | 0.0 /100 | #290 | Tragic 2.7% |
| British West Indians | 0.0 /100 | #291 | Tragic 2.7% |
| Immigrants | Grenada | 0.0 /100 | #292 | Tragic 2.8% |
| Malaysians | 0.0 /100 | #293 | Tragic 2.8% |
| Immigrants | Eritrea | 0.0 /100 | #294 | Tragic 2.8% |
| Houma | 0.0 /100 | #295 | Tragic 2.8% |
| Immigrants | Immigrants | 0.0 /100 | #296 | Tragic 2.8% |
| Immigrants | Cuba | 0.0 /100 | #297 | Tragic 2.8% |
| Immigrants | Dominica | 0.0 /100 | #298 | Tragic 2.8% |
| Central American Indians | 0.0 /100 | #299 | Tragic 2.8% |
| Haitians | 0.0 /100 | #300 | Tragic 2.9% |
| Immigrants | South Eastern Asia | 0.0 /100 | #301 | Tragic 2.9% |
| Immigrants | Caribbean | 0.0 /100 | #302 | Tragic 2.9% |
| Somalis | 0.0 /100 | #303 | Tragic 2.9% |