Somali vs Sierra Leonean No Schooling Completed
COMPARE
Somali
Sierra Leonean
No Schooling Completed
No Schooling Completed Comparison
Somalis
Sierra Leoneans
2.9%
NO SCHOOLING COMPLETED
0.0/ 100
METRIC RATING
303rd/ 347
METRIC RANK
2.3%
NO SCHOOLING COMPLETED
4.1/ 100
METRIC RATING
226th/ 347
METRIC RANK
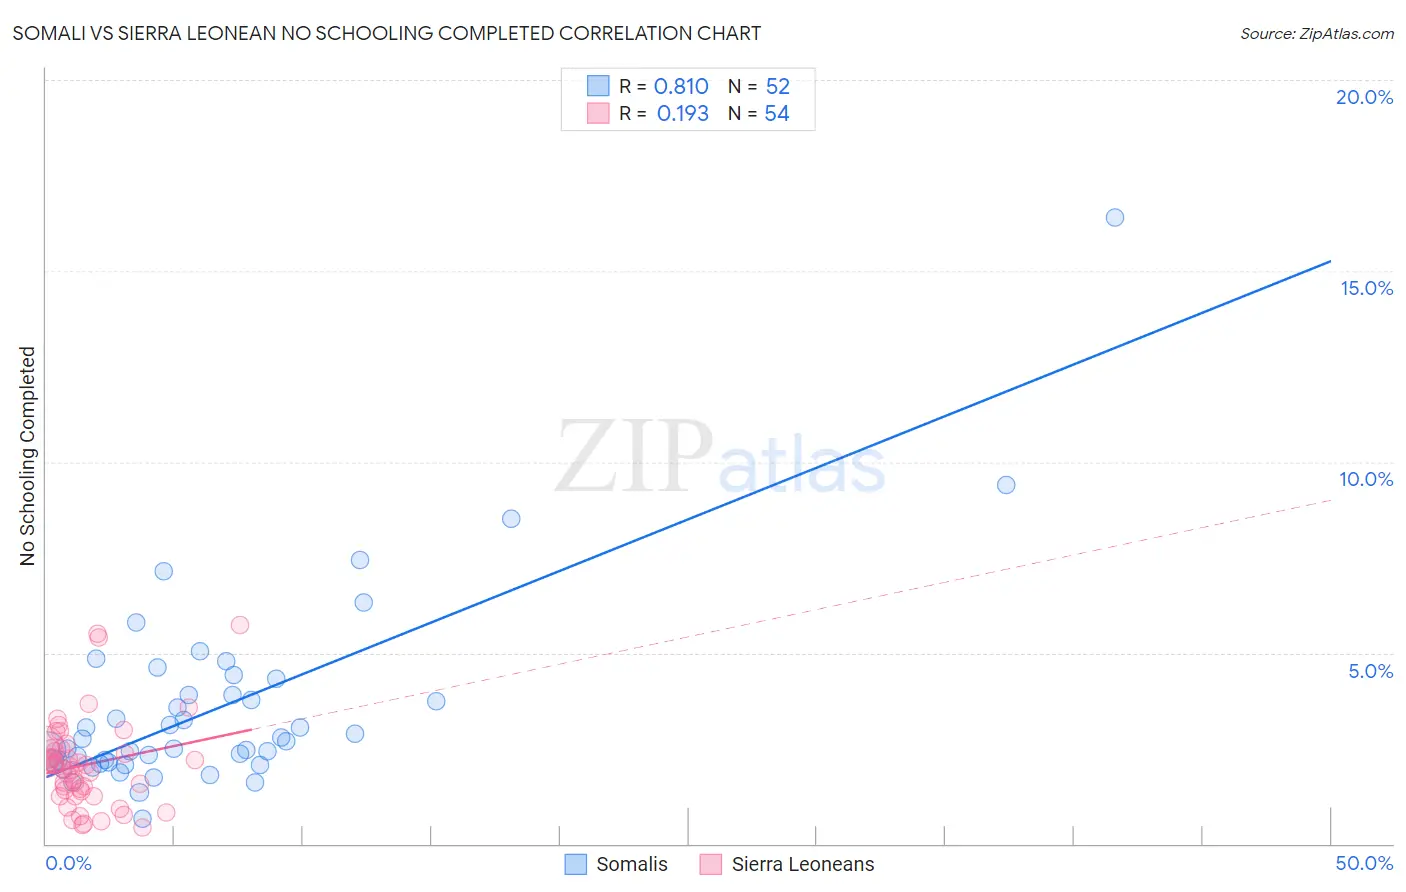
Somali vs Sierra Leonean No Schooling Completed Correlation Chart
The statistical analysis conducted on geographies consisting of 99,157,968 people shows a very strong positive correlation between the proportion of Somalis and percentage of population with no schooling in the United States with a correlation coefficient (R) of 0.810 and weighted average of 2.9%. Similarly, the statistical analysis conducted on geographies consisting of 83,108,801 people shows a poor positive correlation between the proportion of Sierra Leoneans and percentage of population with no schooling in the United States with a correlation coefficient (R) of 0.193 and weighted average of 2.3%, a difference of 27.0%.
No Schooling Completed Correlation Summary
| Measurement | Somali | Sierra Leonean |
| Minimum | 0.66% | 0.44% |
| Maximum | 16.4% | 5.7% |
| Range | 15.8% | 5.3% |
| Mean | 3.6% | 2.1% |
| Median | 2.7% | 2.0% |
| Interquartile 25% (IQ1) | 2.2% | 1.4% |
| Interquartile 75% (IQ3) | 4.1% | 2.5% |
| Interquartile Range (IQR) | 2.0% | 1.1% |
| Standard Deviation (Sample) | 2.6% | 1.2% |
| Standard Deviation (Population) | 2.5% | 1.2% |
Similar Demographics by No Schooling Completed
Demographics Similar to Somalis by No Schooling Completed
In terms of no schooling completed, the demographic groups most similar to Somalis are Nicaraguan (2.9%, a difference of 0.19%), Ecuadorian (3.0%, a difference of 0.66%), Immigrants from Caribbean (2.9%, a difference of 0.99%), Immigrants from South Eastern Asia (2.9%, a difference of 1.4%), and Belizean (3.0%, a difference of 2.3%).
| Demographics | Rating | Rank | No Schooling Completed |
| Immigrants | Immigrants | 0.0 /100 | #296 | Tragic 2.8% |
| Immigrants | Cuba | 0.0 /100 | #297 | Tragic 2.8% |
| Immigrants | Dominica | 0.0 /100 | #298 | Tragic 2.8% |
| Central American Indians | 0.0 /100 | #299 | Tragic 2.8% |
| Haitians | 0.0 /100 | #300 | Tragic 2.9% |
| Immigrants | South Eastern Asia | 0.0 /100 | #301 | Tragic 2.9% |
| Immigrants | Caribbean | 0.0 /100 | #302 | Tragic 2.9% |
| Somalis | 0.0 /100 | #303 | Tragic 2.9% |
| Nicaraguans | 0.0 /100 | #304 | Tragic 2.9% |
| Ecuadorians | 0.0 /100 | #305 | Tragic 3.0% |
| Belizeans | 0.0 /100 | #306 | Tragic 3.0% |
| Immigrants | Haiti | 0.0 /100 | #307 | Tragic 3.0% |
| Immigrants | Somalia | 0.0 /100 | #308 | Tragic 3.0% |
| Hispanics or Latinos | 0.0 /100 | #309 | Tragic 3.0% |
| Guyanese | 0.0 /100 | #310 | Tragic 3.0% |
Demographics Similar to Sierra Leoneans by No Schooling Completed
In terms of no schooling completed, the demographic groups most similar to Sierra Leoneans are Sudanese (2.3%, a difference of 0.010%), Tohono O'odham (2.3%, a difference of 0.020%), Immigrants from Uganda (2.3%, a difference of 0.060%), Immigrants from Lebanon (2.3%, a difference of 0.30%), and U.S. Virgin Islander (2.3%, a difference of 0.34%).
| Demographics | Rating | Rank | No Schooling Completed |
| Senegalese | 5.6 /100 | #219 | Tragic 2.3% |
| Immigrants | Costa Rica | 5.1 /100 | #220 | Tragic 2.3% |
| Immigrants | Sudan | 5.0 /100 | #221 | Tragic 2.3% |
| Sub-Saharan Africans | 4.7 /100 | #222 | Tragic 2.3% |
| Immigrants | Lebanon | 4.5 /100 | #223 | Tragic 2.3% |
| Tohono O'odham | 4.1 /100 | #224 | Tragic 2.3% |
| Sudanese | 4.1 /100 | #225 | Tragic 2.3% |
| Sierra Leoneans | 4.1 /100 | #226 | Tragic 2.3% |
| Immigrants | Uganda | 4.0 /100 | #227 | Tragic 2.3% |
| U.S. Virgin Islanders | 3.7 /100 | #228 | Tragic 2.3% |
| Immigrants | Pakistan | 3.6 /100 | #229 | Tragic 2.3% |
| Puerto Ricans | 3.4 /100 | #230 | Tragic 2.3% |
| Immigrants | Uruguay | 3.4 /100 | #231 | Tragic 2.3% |
| Colombians | 3.2 /100 | #232 | Tragic 2.3% |
| Immigrants | Malaysia | 2.8 /100 | #233 | Tragic 2.3% |