Somali vs Immigrants from Belarus No Schooling Completed
COMPARE
Somali
Immigrants from Belarus
No Schooling Completed
No Schooling Completed Comparison
Somalis
Immigrants from Belarus
2.9%
NO SCHOOLING COMPLETED
0.0/ 100
METRIC RATING
303rd/ 347
METRIC RANK
2.1%
NO SCHOOLING COMPLETED
51.8/ 100
METRIC RATING
173rd/ 347
METRIC RANK
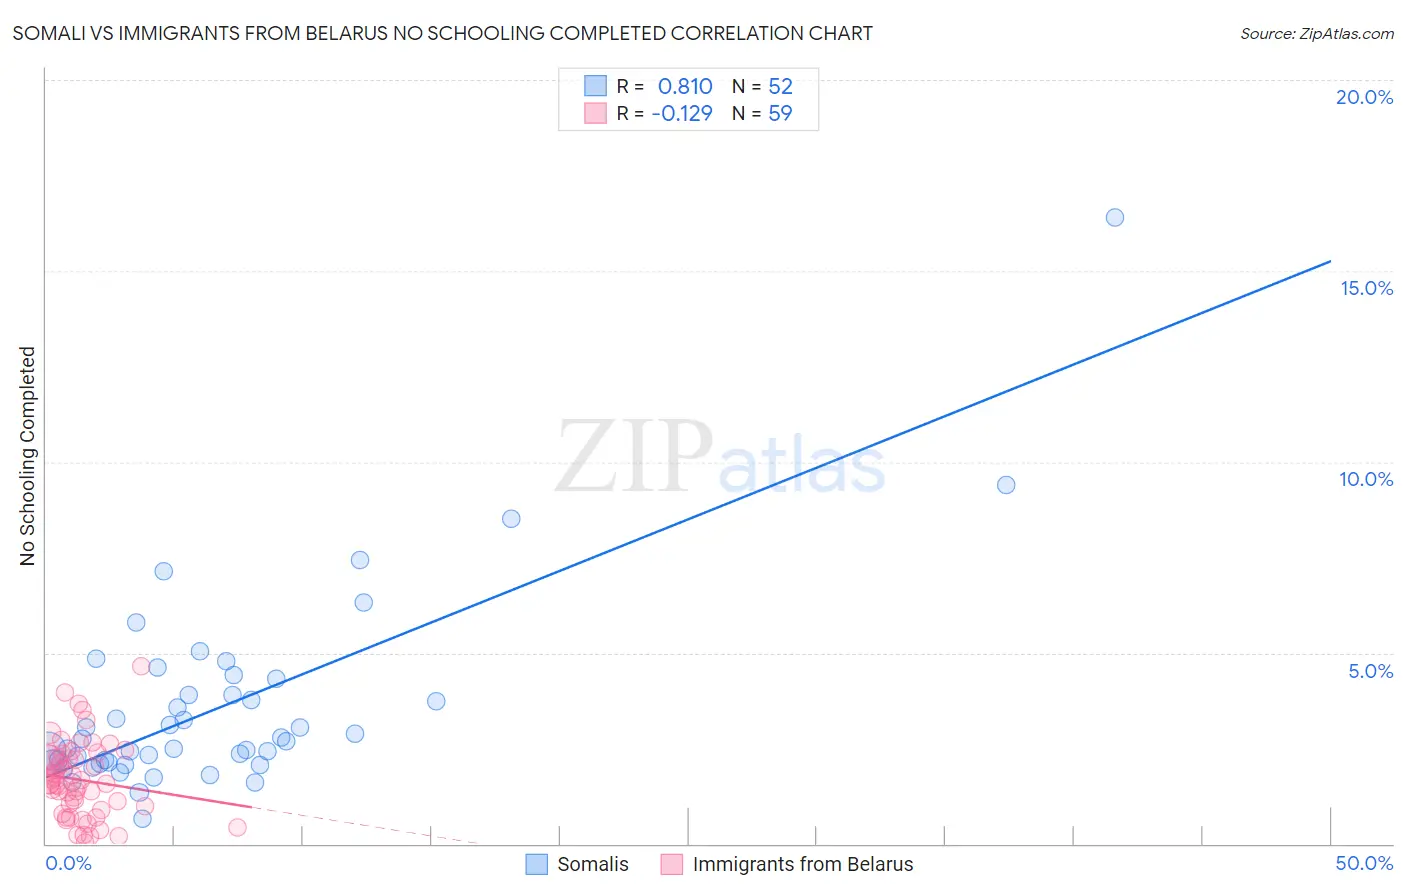
Somali vs Immigrants from Belarus No Schooling Completed Correlation Chart
The statistical analysis conducted on geographies consisting of 99,157,968 people shows a very strong positive correlation between the proportion of Somalis and percentage of population with no schooling in the United States with a correlation coefficient (R) of 0.810 and weighted average of 2.9%. Similarly, the statistical analysis conducted on geographies consisting of 149,360,708 people shows a poor negative correlation between the proportion of Immigrants from Belarus and percentage of population with no schooling in the United States with a correlation coefficient (R) of -0.129 and weighted average of 2.1%, a difference of 40.7%.
No Schooling Completed Correlation Summary
| Measurement | Somali | Immigrants from Belarus |
| Minimum | 0.66% | 0.035% |
| Maximum | 16.4% | 4.6% |
| Range | 15.8% | 4.6% |
| Mean | 3.6% | 1.7% |
| Median | 2.7% | 1.6% |
| Interquartile 25% (IQ1) | 2.2% | 0.89% |
| Interquartile 75% (IQ3) | 4.1% | 2.3% |
| Interquartile Range (IQR) | 2.0% | 1.4% |
| Standard Deviation (Sample) | 2.6% | 1.00% |
| Standard Deviation (Population) | 2.5% | 0.99% |
Similar Demographics by No Schooling Completed
Demographics Similar to Somalis by No Schooling Completed
In terms of no schooling completed, the demographic groups most similar to Somalis are Nicaraguan (2.9%, a difference of 0.19%), Ecuadorian (3.0%, a difference of 0.66%), Immigrants from Caribbean (2.9%, a difference of 0.99%), Immigrants from South Eastern Asia (2.9%, a difference of 1.4%), and Belizean (3.0%, a difference of 2.3%).
| Demographics | Rating | Rank | No Schooling Completed |
| Immigrants | Immigrants | 0.0 /100 | #296 | Tragic 2.8% |
| Immigrants | Cuba | 0.0 /100 | #297 | Tragic 2.8% |
| Immigrants | Dominica | 0.0 /100 | #298 | Tragic 2.8% |
| Central American Indians | 0.0 /100 | #299 | Tragic 2.8% |
| Haitians | 0.0 /100 | #300 | Tragic 2.9% |
| Immigrants | South Eastern Asia | 0.0 /100 | #301 | Tragic 2.9% |
| Immigrants | Caribbean | 0.0 /100 | #302 | Tragic 2.9% |
| Somalis | 0.0 /100 | #303 | Tragic 2.9% |
| Nicaraguans | 0.0 /100 | #304 | Tragic 2.9% |
| Ecuadorians | 0.0 /100 | #305 | Tragic 3.0% |
| Belizeans | 0.0 /100 | #306 | Tragic 3.0% |
| Immigrants | Haiti | 0.0 /100 | #307 | Tragic 3.0% |
| Immigrants | Somalia | 0.0 /100 | #308 | Tragic 3.0% |
| Hispanics or Latinos | 0.0 /100 | #309 | Tragic 3.0% |
| Guyanese | 0.0 /100 | #310 | Tragic 3.0% |
Demographics Similar to Immigrants from Belarus by No Schooling Completed
In terms of no schooling completed, the demographic groups most similar to Immigrants from Belarus are Immigrants from Argentina (2.1%, a difference of 0.13%), Immigrants from Micronesia (2.1%, a difference of 0.24%), Immigrants from Poland (2.1%, a difference of 0.46%), Argentinean (2.1%, a difference of 0.58%), and Apache (2.1%, a difference of 0.67%).
| Demographics | Rating | Rank | No Schooling Completed |
| Dutch West Indians | 59.9 /100 | #166 | Average 2.1% |
| Egyptians | 59.2 /100 | #167 | Average 2.1% |
| Cheyenne | 58.6 /100 | #168 | Average 2.1% |
| Apache | 56.7 /100 | #169 | Average 2.1% |
| Argentineans | 56.0 /100 | #170 | Average 2.1% |
| Immigrants | Poland | 55.2 /100 | #171 | Average 2.1% |
| Immigrants | Argentina | 52.7 /100 | #172 | Average 2.1% |
| Immigrants | Belarus | 51.8 /100 | #173 | Average 2.1% |
| Immigrants | Micronesia | 50.0 /100 | #174 | Average 2.1% |
| Arabs | 46.4 /100 | #175 | Average 2.1% |
| Panamanians | 45.2 /100 | #176 | Average 2.1% |
| Arapaho | 45.0 /100 | #177 | Average 2.1% |
| Pakistanis | 44.7 /100 | #178 | Average 2.1% |
| Immigrants | Kazakhstan | 44.3 /100 | #179 | Average 2.1% |
| Portuguese | 43.9 /100 | #180 | Average 2.1% |