Somali vs Immigrants from Austria No Schooling Completed
COMPARE
Somali
Immigrants from Austria
No Schooling Completed
No Schooling Completed Comparison
Somalis
Immigrants from Austria
2.9%
NO SCHOOLING COMPLETED
0.0/ 100
METRIC RATING
303rd/ 347
METRIC RANK
1.7%
NO SCHOOLING COMPLETED
99.7/ 100
METRIC RATING
67th/ 347
METRIC RANK
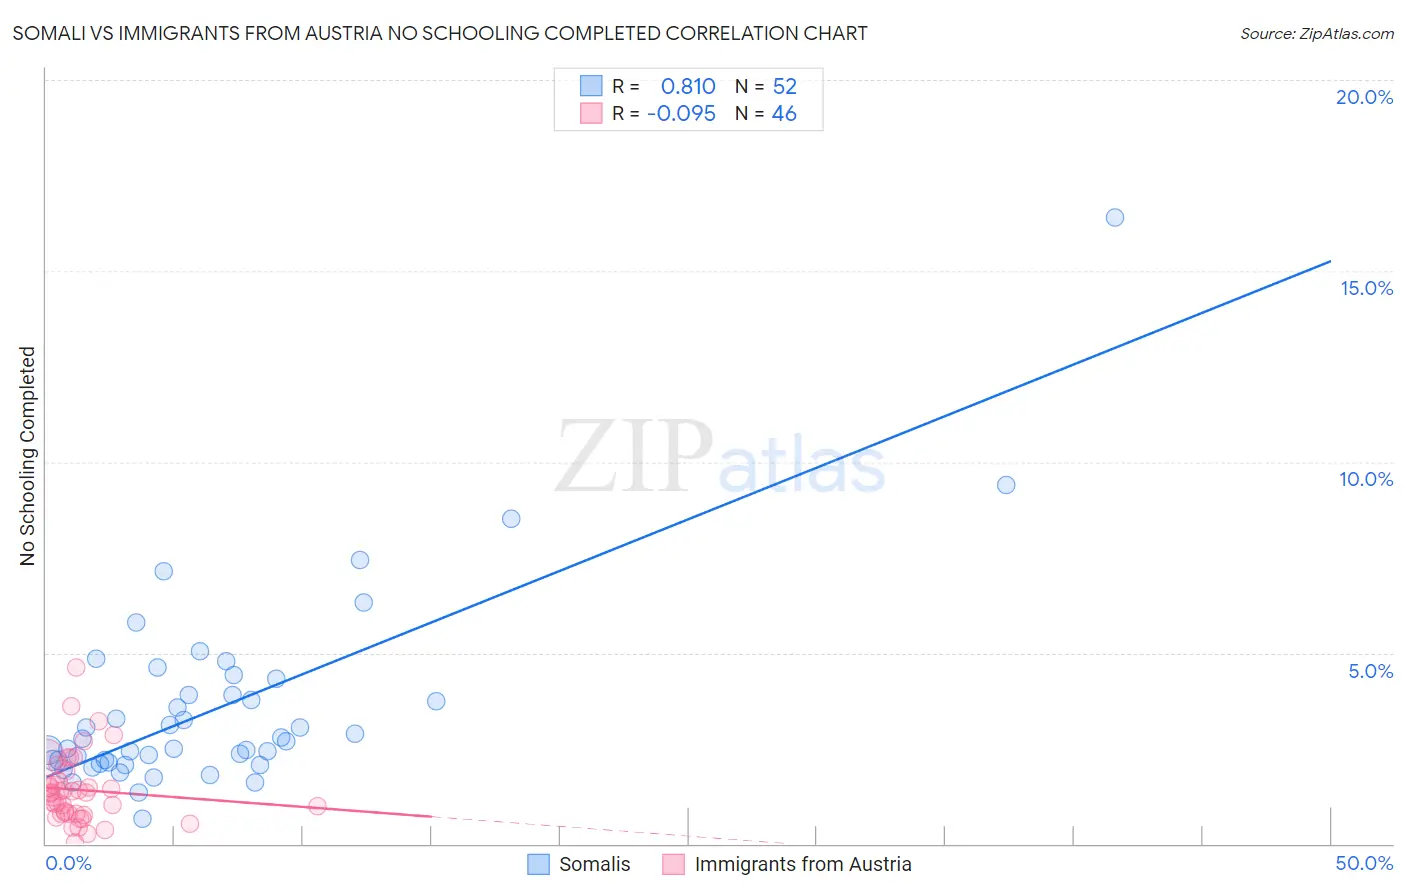
Somali vs Immigrants from Austria No Schooling Completed Correlation Chart
The statistical analysis conducted on geographies consisting of 99,157,968 people shows a very strong positive correlation between the proportion of Somalis and percentage of population with no schooling in the United States with a correlation coefficient (R) of 0.810 and weighted average of 2.9%. Similarly, the statistical analysis conducted on geographies consisting of 166,939,522 people shows a slight negative correlation between the proportion of Immigrants from Austria and percentage of population with no schooling in the United States with a correlation coefficient (R) of -0.095 and weighted average of 1.7%, a difference of 75.0%.
No Schooling Completed Correlation Summary
| Measurement | Somali | Immigrants from Austria |
| Minimum | 0.66% | 0.024% |
| Maximum | 16.4% | 4.6% |
| Range | 15.8% | 4.6% |
| Mean | 3.6% | 1.4% |
| Median | 2.7% | 1.3% |
| Interquartile 25% (IQ1) | 2.2% | 0.78% |
| Interquartile 75% (IQ3) | 4.1% | 1.7% |
| Interquartile Range (IQR) | 2.0% | 0.87% |
| Standard Deviation (Sample) | 2.6% | 0.91% |
| Standard Deviation (Population) | 2.5% | 0.90% |
Similar Demographics by No Schooling Completed
Demographics Similar to Somalis by No Schooling Completed
In terms of no schooling completed, the demographic groups most similar to Somalis are Nicaraguan (2.9%, a difference of 0.19%), Ecuadorian (3.0%, a difference of 0.66%), Immigrants from Caribbean (2.9%, a difference of 0.99%), Immigrants from South Eastern Asia (2.9%, a difference of 1.4%), and Belizean (3.0%, a difference of 2.3%).
| Demographics | Rating | Rank | No Schooling Completed |
| Immigrants | Immigrants | 0.0 /100 | #296 | Tragic 2.8% |
| Immigrants | Cuba | 0.0 /100 | #297 | Tragic 2.8% |
| Immigrants | Dominica | 0.0 /100 | #298 | Tragic 2.8% |
| Central American Indians | 0.0 /100 | #299 | Tragic 2.8% |
| Haitians | 0.0 /100 | #300 | Tragic 2.9% |
| Immigrants | South Eastern Asia | 0.0 /100 | #301 | Tragic 2.9% |
| Immigrants | Caribbean | 0.0 /100 | #302 | Tragic 2.9% |
| Somalis | 0.0 /100 | #303 | Tragic 2.9% |
| Nicaraguans | 0.0 /100 | #304 | Tragic 2.9% |
| Ecuadorians | 0.0 /100 | #305 | Tragic 3.0% |
| Belizeans | 0.0 /100 | #306 | Tragic 3.0% |
| Immigrants | Haiti | 0.0 /100 | #307 | Tragic 3.0% |
| Immigrants | Somalia | 0.0 /100 | #308 | Tragic 3.0% |
| Hispanics or Latinos | 0.0 /100 | #309 | Tragic 3.0% |
| Guyanese | 0.0 /100 | #310 | Tragic 3.0% |
Demographics Similar to Immigrants from Austria by No Schooling Completed
In terms of no schooling completed, the demographic groups most similar to Immigrants from Austria are Canadian (1.7%, a difference of 0.19%), Serbian (1.7%, a difference of 0.33%), New Zealander (1.7%, a difference of 0.37%), Russian (1.7%, a difference of 0.53%), and Immigrants from Northern Europe (1.7%, a difference of 0.57%).
| Demographics | Rating | Rank | No Schooling Completed |
| Americans | 99.8 /100 | #60 | Exceptional 1.7% |
| Tsimshian | 99.8 /100 | #61 | Exceptional 1.7% |
| Immigrants | Northern Europe | 99.8 /100 | #62 | Exceptional 1.7% |
| Russians | 99.8 /100 | #63 | Exceptional 1.7% |
| New Zealanders | 99.7 /100 | #64 | Exceptional 1.7% |
| Serbians | 99.7 /100 | #65 | Exceptional 1.7% |
| Canadians | 99.7 /100 | #66 | Exceptional 1.7% |
| Immigrants | Austria | 99.7 /100 | #67 | Exceptional 1.7% |
| Immigrants | Lithuania | 99.7 /100 | #68 | Exceptional 1.7% |
| Chickasaw | 99.6 /100 | #69 | Exceptional 1.7% |
| Immigrants | Netherlands | 99.6 /100 | #70 | Exceptional 1.7% |
| Immigrants | England | 99.5 /100 | #71 | Exceptional 1.7% |
| Cajuns | 99.5 /100 | #72 | Exceptional 1.7% |
| Immigrants | India | 99.4 /100 | #73 | Exceptional 1.7% |
| Zimbabweans | 99.4 /100 | #74 | Exceptional 1.7% |