Samoan vs Immigrants from Nigeria No Schooling Completed
COMPARE
Samoan
Immigrants from Nigeria
No Schooling Completed
No Schooling Completed Comparison
Samoans
Immigrants from Nigeria
2.3%
NO SCHOOLING COMPLETED
8.2/ 100
METRIC RATING
214th/ 347
METRIC RANK
2.5%
NO SCHOOLING COMPLETED
0.2/ 100
METRIC RATING
269th/ 347
METRIC RANK
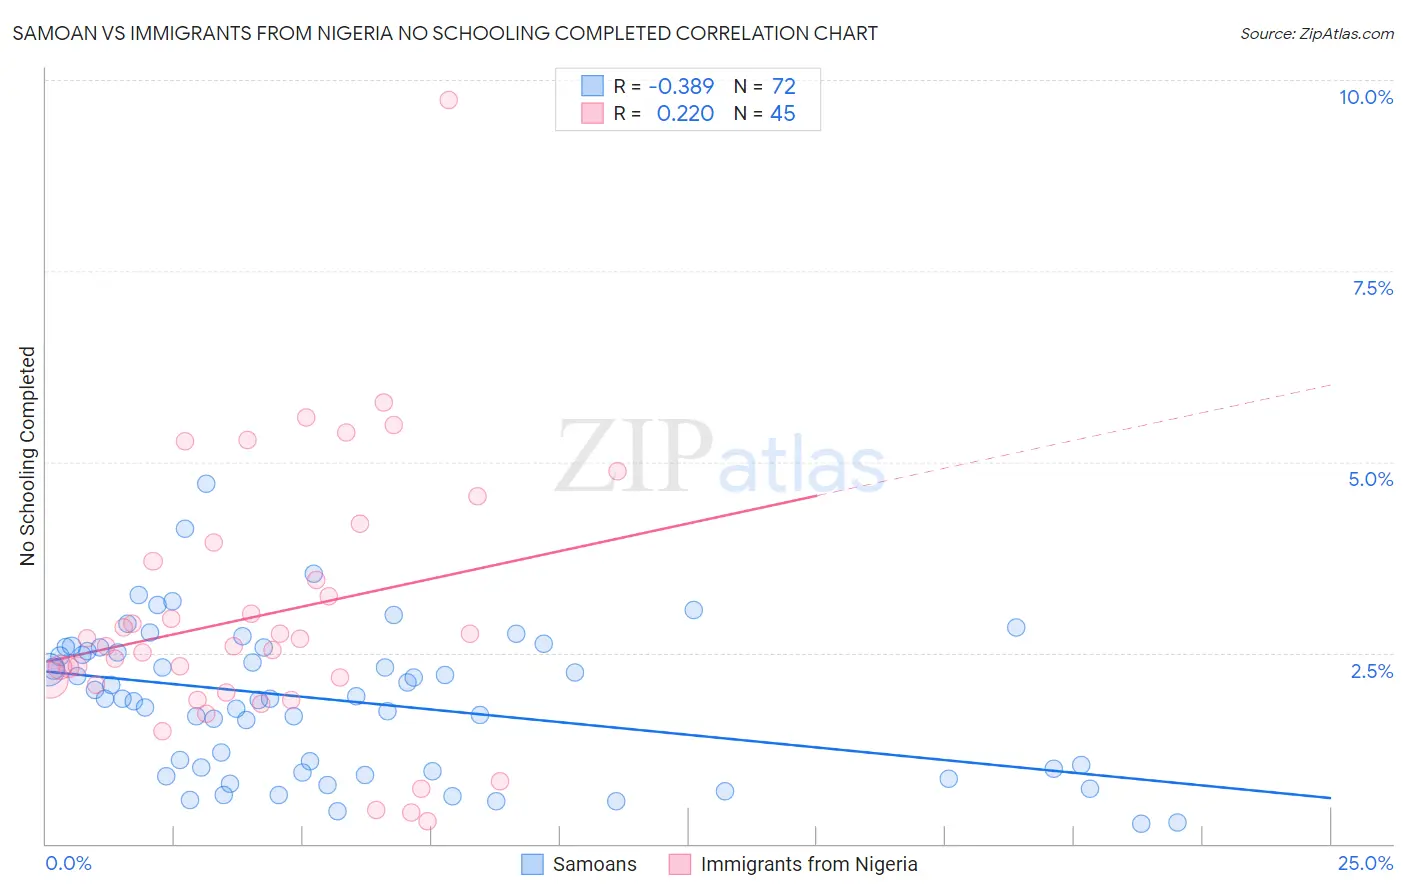
Samoan vs Immigrants from Nigeria No Schooling Completed Correlation Chart
The statistical analysis conducted on geographies consisting of 223,861,902 people shows a mild negative correlation between the proportion of Samoans and percentage of population with no schooling in the United States with a correlation coefficient (R) of -0.389 and weighted average of 2.3%. Similarly, the statistical analysis conducted on geographies consisting of 282,263,250 people shows a weak positive correlation between the proportion of Immigrants from Nigeria and percentage of population with no schooling in the United States with a correlation coefficient (R) of 0.220 and weighted average of 2.5%, a difference of 11.1%.
No Schooling Completed Correlation Summary
| Measurement | Samoan | Immigrants from Nigeria |
| Minimum | 0.26% | 0.30% |
| Maximum | 4.7% | 9.7% |
| Range | 4.5% | 9.4% |
| Mean | 1.9% | 3.0% |
| Median | 1.9% | 2.6% |
| Interquartile 25% (IQ1) | 0.97% | 2.0% |
| Interquartile 75% (IQ3) | 2.5% | 3.8% |
| Interquartile Range (IQR) | 1.6% | 1.8% |
| Standard Deviation (Sample) | 0.95% | 1.8% |
| Standard Deviation (Population) | 0.95% | 1.7% |
Similar Demographics by No Schooling Completed
Demographics Similar to Samoans by No Schooling Completed
In terms of no schooling completed, the demographic groups most similar to Samoans are Ute (2.3%, a difference of 0.040%), Immigrants from Morocco (2.3%, a difference of 0.23%), Immigrants from Panama (2.3%, a difference of 0.24%), Immigrants from Zaire (2.3%, a difference of 0.43%), and Tongan (2.3%, a difference of 0.63%).
| Demographics | Rating | Rank | No Schooling Completed |
| South American Indians | 11.0 /100 | #207 | Poor 2.2% |
| Uruguayans | 11.0 /100 | #208 | Poor 2.2% |
| Immigrants | Oceania | 10.2 /100 | #209 | Poor 2.2% |
| Natives/Alaskans | 10.0 /100 | #210 | Tragic 2.2% |
| Immigrants | Panama | 8.8 /100 | #211 | Tragic 2.3% |
| Immigrants | Morocco | 8.7 /100 | #212 | Tragic 2.3% |
| Ute | 8.2 /100 | #213 | Tragic 2.3% |
| Samoans | 8.2 /100 | #214 | Tragic 2.3% |
| Immigrants | Zaire | 7.2 /100 | #215 | Tragic 2.3% |
| Tongans | 6.8 /100 | #216 | Tragic 2.3% |
| Immigrants | Syria | 6.6 /100 | #217 | Tragic 2.3% |
| Immigrants | Nepal | 6.4 /100 | #218 | Tragic 2.3% |
| Senegalese | 5.6 /100 | #219 | Tragic 2.3% |
| Immigrants | Costa Rica | 5.1 /100 | #220 | Tragic 2.3% |
| Immigrants | Sudan | 5.0 /100 | #221 | Tragic 2.3% |
Demographics Similar to Immigrants from Nigeria by No Schooling Completed
In terms of no schooling completed, the demographic groups most similar to Immigrants from Nigeria are Immigrants from Peru (2.5%, a difference of 0.080%), Cuban (2.5%, a difference of 0.090%), Immigrants from Bolivia (2.5%, a difference of 0.62%), Taiwanese (2.5%, a difference of 0.86%), and Yuman (2.5%, a difference of 1.1%).
| Demographics | Rating | Rank | No Schooling Completed |
| Immigrants | Sierra Leone | 0.5 /100 | #262 | Tragic 2.5% |
| Immigrants | Liberia | 0.4 /100 | #263 | Tragic 2.5% |
| Indians (Asian) | 0.4 /100 | #264 | Tragic 2.5% |
| West Indians | 0.4 /100 | #265 | Tragic 2.5% |
| Fijians | 0.4 /100 | #266 | Tragic 2.5% |
| Yuman | 0.4 /100 | #267 | Tragic 2.5% |
| Taiwanese | 0.3 /100 | #268 | Tragic 2.5% |
| Immigrants | Nigeria | 0.2 /100 | #269 | Tragic 2.5% |
| Immigrants | Peru | 0.2 /100 | #270 | Tragic 2.5% |
| Cubans | 0.2 /100 | #271 | Tragic 2.5% |
| Immigrants | Bolivia | 0.2 /100 | #272 | Tragic 2.5% |
| Immigrants | Cameroon | 0.1 /100 | #273 | Tragic 2.5% |
| Ghanaians | 0.1 /100 | #274 | Tragic 2.6% |
| Immigrants | China | 0.1 /100 | #275 | Tragic 2.6% |
| Immigrants | Western Africa | 0.1 /100 | #276 | Tragic 2.6% |