Somali vs Immigrants from Australia 9th Grade
COMPARE
Somali
Immigrants from Australia
9th Grade
9th Grade Comparison
Somalis
Immigrants from Australia
94.3%
9TH GRADE
2.9/ 100
METRIC RATING
236th/ 347
METRIC RANK
95.8%
9TH GRADE
99.5/ 100
METRIC RATING
70th/ 347
METRIC RANK
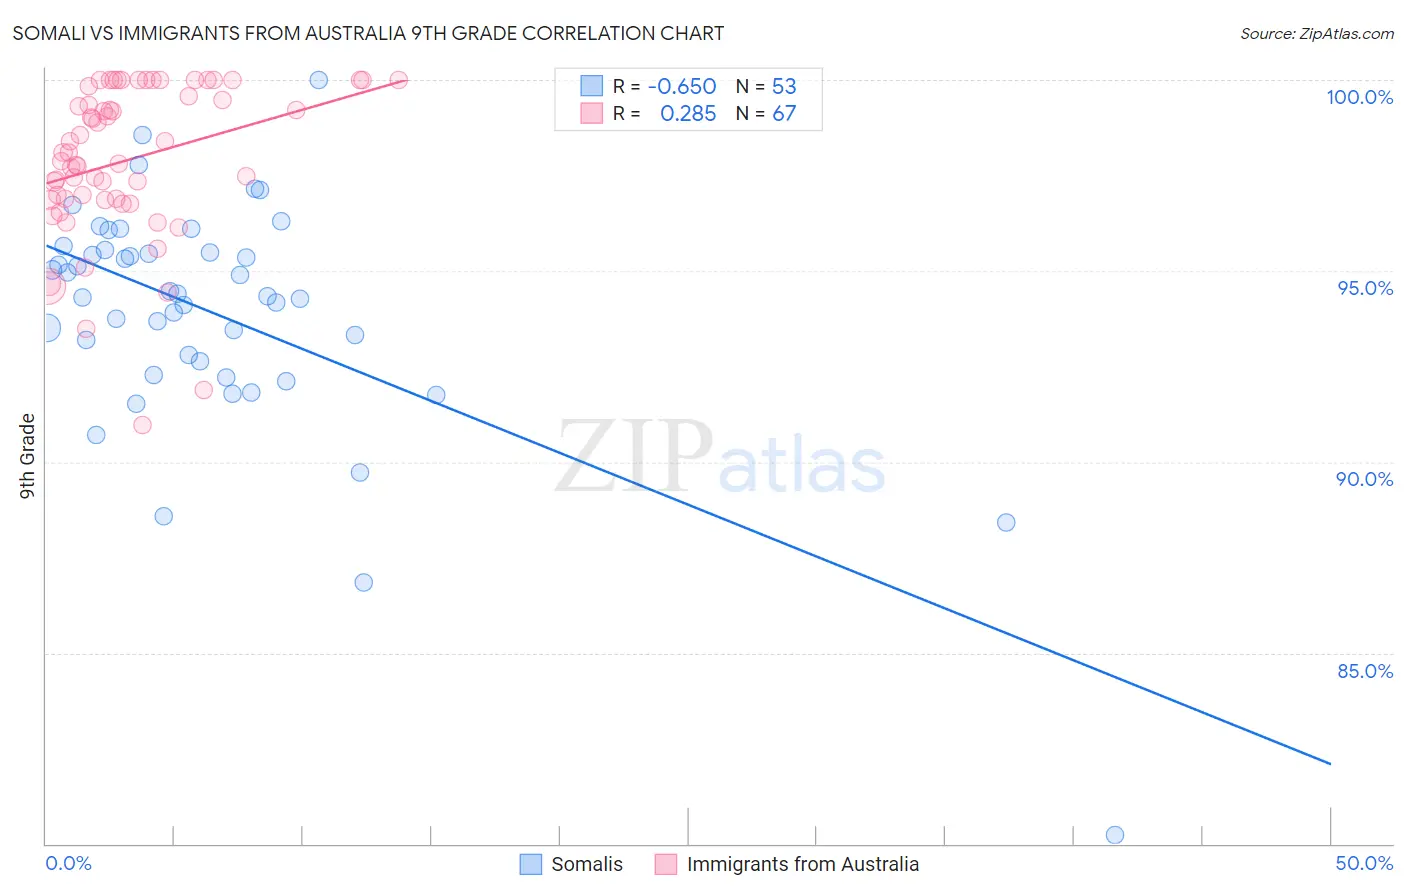
Somali vs Immigrants from Australia 9th Grade Correlation Chart
The statistical analysis conducted on geographies consisting of 99,330,527 people shows a significant negative correlation between the proportion of Somalis and percentage of population with at least 9th grade education in the United States with a correlation coefficient (R) of -0.650 and weighted average of 94.3%. Similarly, the statistical analysis conducted on geographies consisting of 227,202,602 people shows a weak positive correlation between the proportion of Immigrants from Australia and percentage of population with at least 9th grade education in the United States with a correlation coefficient (R) of 0.285 and weighted average of 95.8%, a difference of 1.6%.
9th Grade Correlation Summary
| Measurement | Somali | Immigrants from Australia |
| Minimum | 80.2% | 91.0% |
| Maximum | 100.0% | 100.0% |
| Range | 19.8% | 9.0% |
| Mean | 93.9% | 97.9% |
| Median | 94.4% | 98.1% |
| Interquartile 25% (IQ1) | 92.5% | 96.9% |
| Interquartile 75% (IQ3) | 95.5% | 99.8% |
| Interquartile Range (IQR) | 3.1% | 3.0% |
| Standard Deviation (Sample) | 3.1% | 2.0% |
| Standard Deviation (Population) | 3.1% | 2.0% |
Similar Demographics by 9th Grade
Demographics Similar to Somalis by 9th Grade
In terms of 9th grade, the demographic groups most similar to Somalis are Korean (94.3%, a difference of 0.0%), South American Indian (94.3%, a difference of 0.010%), Immigrants from China (94.3%, a difference of 0.010%), Bolivian (94.3%, a difference of 0.020%), and Immigrants from Ethiopia (94.3%, a difference of 0.020%).
| Demographics | Rating | Rank | 9th Grade |
| Immigrants | Southern Europe | 4.5 /100 | #229 | Tragic 94.3% |
| Apache | 4.2 /100 | #230 | Tragic 94.3% |
| Immigrants | Panama | 4.0 /100 | #231 | Tragic 94.3% |
| Immigrants | Africa | 3.9 /100 | #232 | Tragic 94.3% |
| Nigerians | 3.7 /100 | #233 | Tragic 94.3% |
| Costa Ricans | 3.5 /100 | #234 | Tragic 94.3% |
| Bolivians | 3.3 /100 | #235 | Tragic 94.3% |
| Somalis | 2.9 /100 | #236 | Tragic 94.3% |
| Koreans | 2.9 /100 | #237 | Tragic 94.3% |
| South American Indians | 2.8 /100 | #238 | Tragic 94.3% |
| Immigrants | China | 2.8 /100 | #239 | Tragic 94.3% |
| Immigrants | Ethiopia | 2.7 /100 | #240 | Tragic 94.3% |
| Spanish Americans | 2.6 /100 | #241 | Tragic 94.2% |
| Immigrants | Middle Africa | 2.2 /100 | #242 | Tragic 94.2% |
| Immigrants | Cameroon | 2.1 /100 | #243 | Tragic 94.2% |
Demographics Similar to Immigrants from Australia by 9th Grade
In terms of 9th grade, the demographic groups most similar to Immigrants from Australia are Immigrants from Belgium (95.8%, a difference of 0.010%), Turkish (95.8%, a difference of 0.010%), Immigrants from Singapore (95.8%, a difference of 0.010%), Thai (95.8%, a difference of 0.010%), and Cypriot (95.8%, a difference of 0.020%).
| Demographics | Rating | Rank | 9th Grade |
| Canadians | 99.7 /100 | #63 | Exceptional 95.9% |
| Zimbabweans | 99.7 /100 | #64 | Exceptional 95.9% |
| Immigrants | England | 99.6 /100 | #65 | Exceptional 95.9% |
| Immigrants | Netherlands | 99.6 /100 | #66 | Exceptional 95.8% |
| Cypriots | 99.6 /100 | #67 | Exceptional 95.8% |
| Immigrants | Ireland | 99.6 /100 | #68 | Exceptional 95.8% |
| Immigrants | Lithuania | 99.6 /100 | #69 | Exceptional 95.8% |
| Immigrants | Australia | 99.5 /100 | #70 | Exceptional 95.8% |
| Immigrants | Belgium | 99.5 /100 | #71 | Exceptional 95.8% |
| Turks | 99.5 /100 | #72 | Exceptional 95.8% |
| Immigrants | Singapore | 99.5 /100 | #73 | Exceptional 95.8% |
| Thais | 99.5 /100 | #74 | Exceptional 95.8% |
| Inupiat | 99.5 /100 | #75 | Exceptional 95.8% |
| Immigrants | Sweden | 99.5 /100 | #76 | Exceptional 95.8% |
| Whites/Caucasians | 99.4 /100 | #77 | Exceptional 95.8% |