Spanish American Indian vs Immigrants from Belarus No Schooling Completed
COMPARE
Spanish American Indian
Immigrants from Belarus
No Schooling Completed
No Schooling Completed Comparison
Spanish American Indians
Immigrants from Belarus
4.2%
NO SCHOOLING COMPLETED
0.0/ 100
METRIC RATING
347th/ 347
METRIC RANK
2.1%
NO SCHOOLING COMPLETED
51.8/ 100
METRIC RATING
173rd/ 347
METRIC RANK
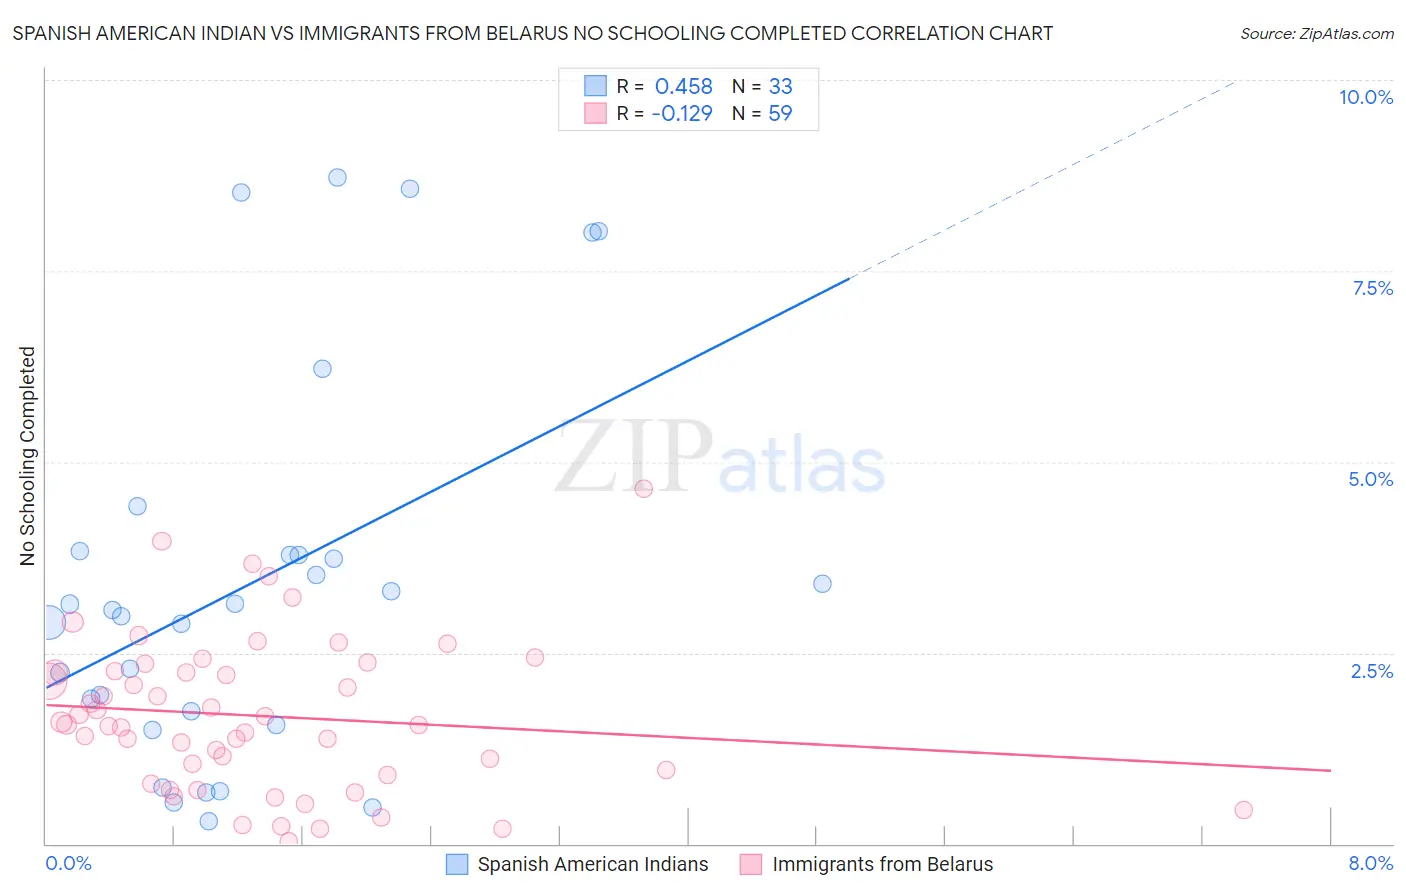
Spanish American Indian vs Immigrants from Belarus No Schooling Completed Correlation Chart
The statistical analysis conducted on geographies consisting of 73,096,872 people shows a moderate positive correlation between the proportion of Spanish American Indians and percentage of population with no schooling in the United States with a correlation coefficient (R) of 0.458 and weighted average of 4.2%. Similarly, the statistical analysis conducted on geographies consisting of 149,360,708 people shows a poor negative correlation between the proportion of Immigrants from Belarus and percentage of population with no schooling in the United States with a correlation coefficient (R) of -0.129 and weighted average of 2.1%, a difference of 100.9%.
No Schooling Completed Correlation Summary
| Measurement | Spanish American Indian | Immigrants from Belarus |
| Minimum | 0.30% | 0.035% |
| Maximum | 8.7% | 4.6% |
| Range | 8.4% | 4.6% |
| Mean | 3.4% | 1.7% |
| Median | 3.1% | 1.6% |
| Interquartile 25% (IQ1) | 1.6% | 0.89% |
| Interquartile 75% (IQ3) | 3.8% | 2.3% |
| Interquartile Range (IQR) | 2.2% | 1.4% |
| Standard Deviation (Sample) | 2.5% | 1.00% |
| Standard Deviation (Population) | 2.5% | 0.99% |
Similar Demographics by No Schooling Completed
Demographics Similar to Spanish American Indians by No Schooling Completed
In terms of no schooling completed, the demographic groups most similar to Spanish American Indians are Immigrants from Yemen (4.1%, a difference of 1.5%), Immigrants from El Salvador (3.9%, a difference of 8.1%), Nepalese (3.8%, a difference of 10.1%), Salvadoran (3.7%, a difference of 11.9%), and Immigrants from Mexico (3.6%, a difference of 15.0%).
| Demographics | Rating | Rank | No Schooling Completed |
| Immigrants | Dominican Republic | 0.0 /100 | #333 | Tragic 3.4% |
| Guatemalans | 0.0 /100 | #334 | Tragic 3.5% |
| Immigrants | Cambodia | 0.0 /100 | #335 | Tragic 3.5% |
| Immigrants | Fiji | 0.0 /100 | #336 | Tragic 3.5% |
| Immigrants | Cabo Verde | 0.0 /100 | #337 | Tragic 3.5% |
| Bangladeshis | 0.0 /100 | #338 | Tragic 3.5% |
| Yakama | 0.0 /100 | #339 | Tragic 3.6% |
| Immigrants | Guatemala | 0.0 /100 | #340 | Tragic 3.6% |
| Immigrants | Central America | 0.0 /100 | #341 | Tragic 3.6% |
| Immigrants | Mexico | 0.0 /100 | #342 | Tragic 3.6% |
| Salvadorans | 0.0 /100 | #343 | Tragic 3.7% |
| Nepalese | 0.0 /100 | #344 | Tragic 3.8% |
| Immigrants | El Salvador | 0.0 /100 | #345 | Tragic 3.9% |
| Immigrants | Yemen | 0.0 /100 | #346 | Tragic 4.1% |
| Spanish American Indians | 0.0 /100 | #347 | Tragic 4.2% |
Demographics Similar to Immigrants from Belarus by No Schooling Completed
In terms of no schooling completed, the demographic groups most similar to Immigrants from Belarus are Immigrants from Argentina (2.1%, a difference of 0.13%), Immigrants from Micronesia (2.1%, a difference of 0.24%), Immigrants from Poland (2.1%, a difference of 0.46%), Argentinean (2.1%, a difference of 0.58%), and Apache (2.1%, a difference of 0.67%).
| Demographics | Rating | Rank | No Schooling Completed |
| Dutch West Indians | 59.9 /100 | #166 | Average 2.1% |
| Egyptians | 59.2 /100 | #167 | Average 2.1% |
| Cheyenne | 58.6 /100 | #168 | Average 2.1% |
| Apache | 56.7 /100 | #169 | Average 2.1% |
| Argentineans | 56.0 /100 | #170 | Average 2.1% |
| Immigrants | Poland | 55.2 /100 | #171 | Average 2.1% |
| Immigrants | Argentina | 52.7 /100 | #172 | Average 2.1% |
| Immigrants | Belarus | 51.8 /100 | #173 | Average 2.1% |
| Immigrants | Micronesia | 50.0 /100 | #174 | Average 2.1% |
| Arabs | 46.4 /100 | #175 | Average 2.1% |
| Panamanians | 45.2 /100 | #176 | Average 2.1% |
| Arapaho | 45.0 /100 | #177 | Average 2.1% |
| Pakistanis | 44.7 /100 | #178 | Average 2.1% |
| Immigrants | Kazakhstan | 44.3 /100 | #179 | Average 2.1% |
| Portuguese | 43.9 /100 | #180 | Average 2.1% |