Indonesian vs Immigrants from Belarus No Schooling Completed
COMPARE
Indonesian
Immigrants from Belarus
No Schooling Completed
No Schooling Completed Comparison
Indonesians
Immigrants from Belarus
3.2%
NO SCHOOLING COMPLETED
0.0/ 100
METRIC RATING
326th/ 347
METRIC RANK
2.1%
NO SCHOOLING COMPLETED
51.8/ 100
METRIC RATING
173rd/ 347
METRIC RANK
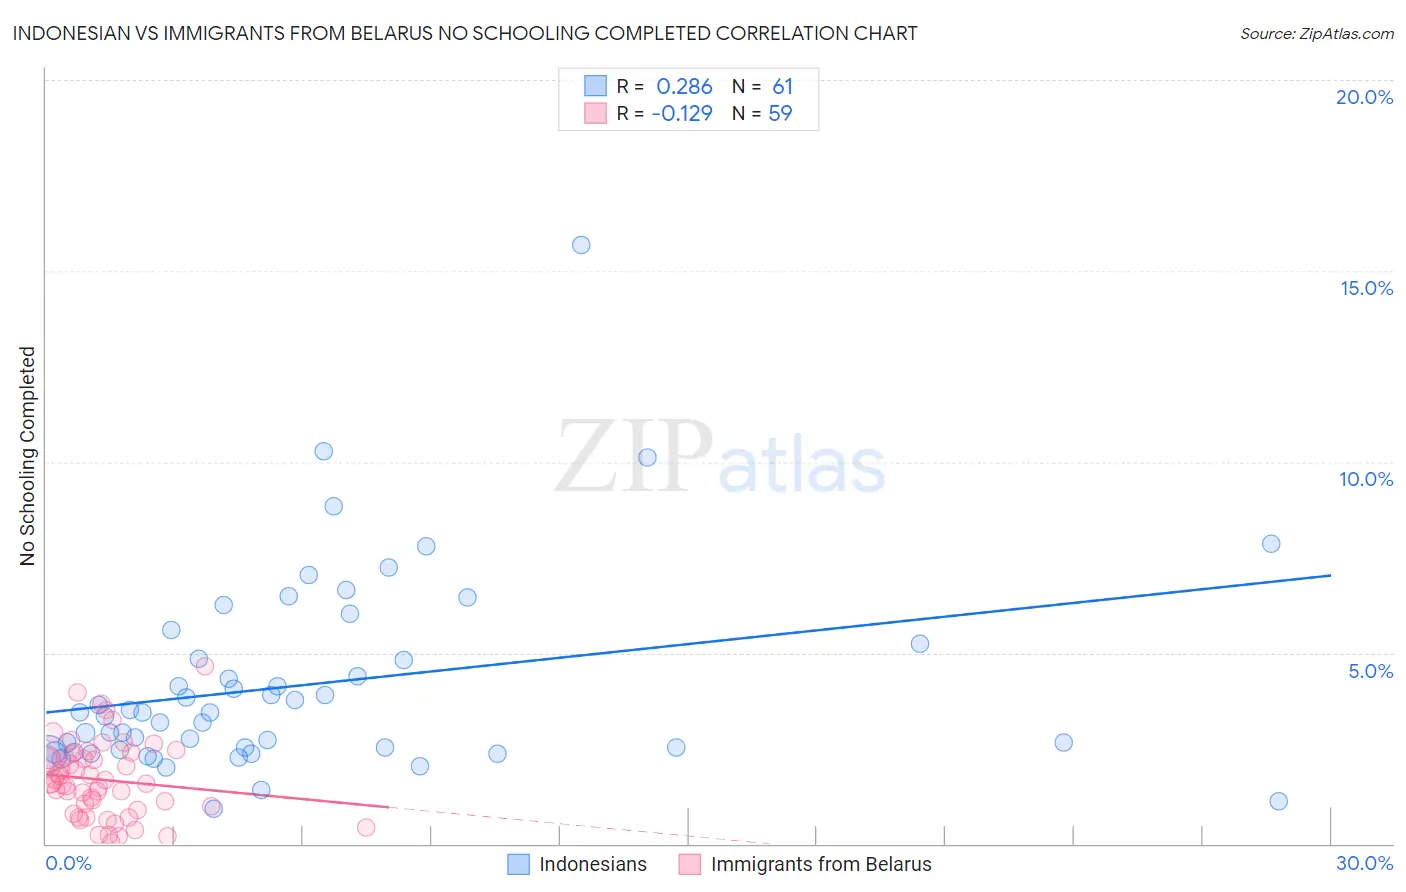
Indonesian vs Immigrants from Belarus No Schooling Completed Correlation Chart
The statistical analysis conducted on geographies consisting of 162,153,140 people shows a weak positive correlation between the proportion of Indonesians and percentage of population with no schooling in the United States with a correlation coefficient (R) of 0.286 and weighted average of 3.2%. Similarly, the statistical analysis conducted on geographies consisting of 149,360,708 people shows a poor negative correlation between the proportion of Immigrants from Belarus and percentage of population with no schooling in the United States with a correlation coefficient (R) of -0.129 and weighted average of 2.1%, a difference of 53.8%.
No Schooling Completed Correlation Summary
| Measurement | Indonesian | Immigrants from Belarus |
| Minimum | 0.92% | 0.035% |
| Maximum | 15.7% | 4.6% |
| Range | 14.8% | 4.6% |
| Mean | 4.2% | 1.7% |
| Median | 3.4% | 1.6% |
| Interquartile 25% (IQ1) | 2.4% | 0.89% |
| Interquartile 75% (IQ3) | 5.0% | 2.3% |
| Interquartile Range (IQR) | 2.6% | 1.4% |
| Standard Deviation (Sample) | 2.6% | 1.00% |
| Standard Deviation (Population) | 2.6% | 0.99% |
Similar Demographics by No Schooling Completed
Demographics Similar to Indonesians by No Schooling Completed
In terms of no schooling completed, the demographic groups most similar to Indonesians are Dominican (3.2%, a difference of 0.030%), Mexican American Indian (3.2%, a difference of 0.70%), Vietnamese (3.2%, a difference of 1.1%), Immigrants from Honduras (3.2%, a difference of 1.2%), and Immigrants from Laos (3.1%, a difference of 1.9%).
| Demographics | Rating | Rank | No Schooling Completed |
| Immigrants | Burma/Myanmar | 0.0 /100 | #319 | Tragic 3.1% |
| Immigrants | Bangladesh | 0.0 /100 | #320 | Tragic 3.1% |
| Immigrants | Laos | 0.0 /100 | #321 | Tragic 3.1% |
| Immigrants | Honduras | 0.0 /100 | #322 | Tragic 3.2% |
| Vietnamese | 0.0 /100 | #323 | Tragic 3.2% |
| Mexican American Indians | 0.0 /100 | #324 | Tragic 3.2% |
| Dominicans | 0.0 /100 | #325 | Tragic 3.2% |
| Indonesians | 0.0 /100 | #326 | Tragic 3.2% |
| Immigrants | Latin America | 0.0 /100 | #327 | Tragic 3.3% |
| Mexicans | 0.0 /100 | #328 | Tragic 3.3% |
| Immigrants | Vietnam | 0.0 /100 | #329 | Tragic 3.3% |
| Immigrants | Armenia | 0.0 /100 | #330 | Tragic 3.3% |
| Japanese | 0.0 /100 | #331 | Tragic 3.3% |
| Central Americans | 0.0 /100 | #332 | Tragic 3.4% |
| Immigrants | Dominican Republic | 0.0 /100 | #333 | Tragic 3.4% |
Demographics Similar to Immigrants from Belarus by No Schooling Completed
In terms of no schooling completed, the demographic groups most similar to Immigrants from Belarus are Immigrants from Argentina (2.1%, a difference of 0.13%), Immigrants from Micronesia (2.1%, a difference of 0.24%), Immigrants from Poland (2.1%, a difference of 0.46%), Argentinean (2.1%, a difference of 0.58%), and Apache (2.1%, a difference of 0.67%).
| Demographics | Rating | Rank | No Schooling Completed |
| Dutch West Indians | 59.9 /100 | #166 | Average 2.1% |
| Egyptians | 59.2 /100 | #167 | Average 2.1% |
| Cheyenne | 58.6 /100 | #168 | Average 2.1% |
| Apache | 56.7 /100 | #169 | Average 2.1% |
| Argentineans | 56.0 /100 | #170 | Average 2.1% |
| Immigrants | Poland | 55.2 /100 | #171 | Average 2.1% |
| Immigrants | Argentina | 52.7 /100 | #172 | Average 2.1% |
| Immigrants | Belarus | 51.8 /100 | #173 | Average 2.1% |
| Immigrants | Micronesia | 50.0 /100 | #174 | Average 2.1% |
| Arabs | 46.4 /100 | #175 | Average 2.1% |
| Panamanians | 45.2 /100 | #176 | Average 2.1% |
| Arapaho | 45.0 /100 | #177 | Average 2.1% |
| Pakistanis | 44.7 /100 | #178 | Average 2.1% |
| Immigrants | Kazakhstan | 44.3 /100 | #179 | Average 2.1% |
| Portuguese | 43.9 /100 | #180 | Average 2.1% |