Maltese vs Immigrants from Belarus No Schooling Completed
COMPARE
Maltese
Immigrants from Belarus
No Schooling Completed
No Schooling Completed Comparison
Maltese
Immigrants from Belarus
1.6%
NO SCHOOLING COMPLETED
99.9/ 100
METRIC RATING
46th/ 347
METRIC RANK
2.1%
NO SCHOOLING COMPLETED
51.8/ 100
METRIC RATING
173rd/ 347
METRIC RANK
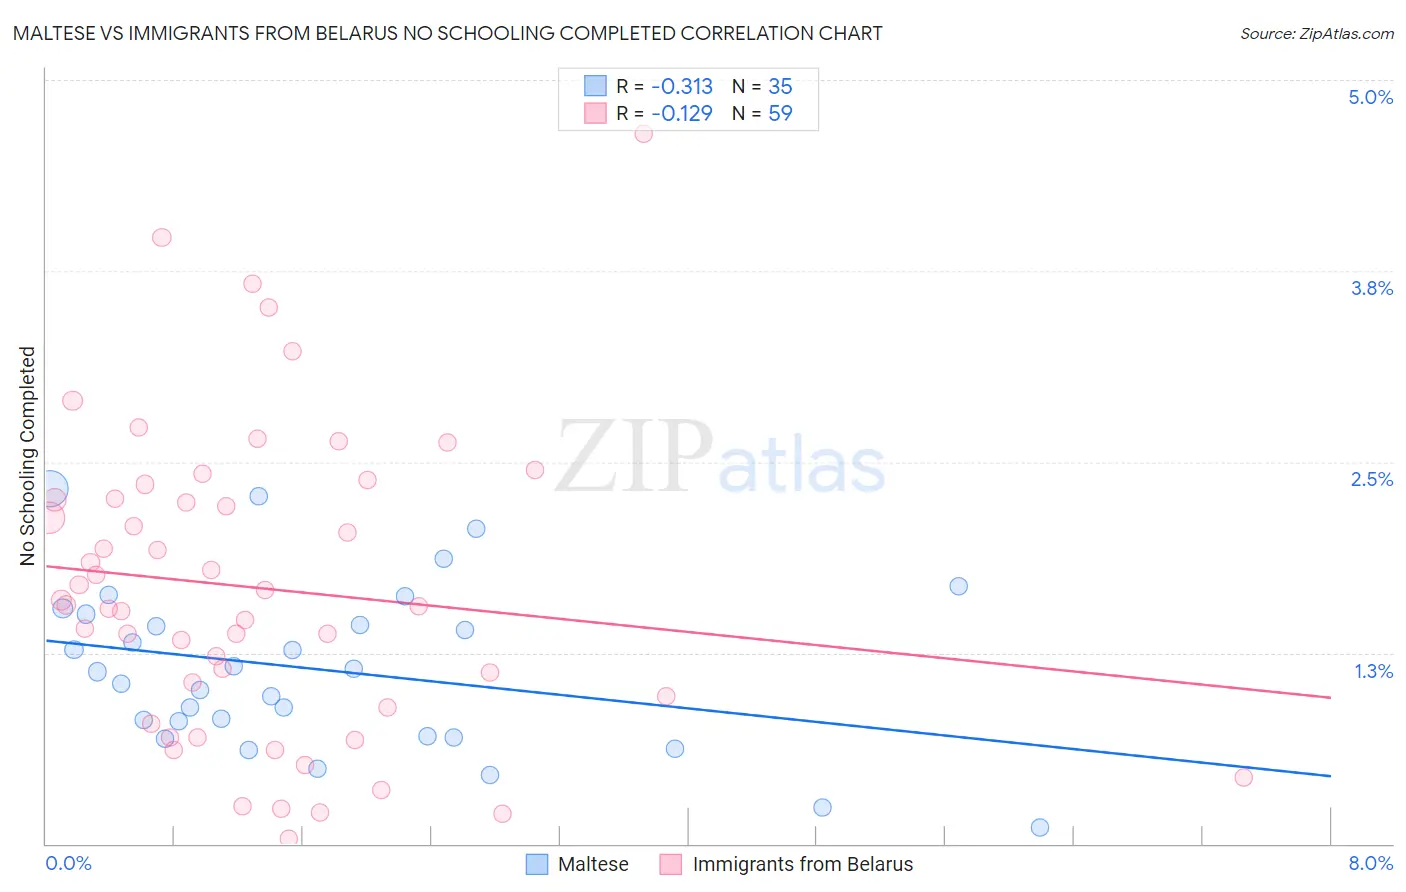
Maltese vs Immigrants from Belarus No Schooling Completed Correlation Chart
The statistical analysis conducted on geographies consisting of 126,020,620 people shows a mild negative correlation between the proportion of Maltese and percentage of population with no schooling in the United States with a correlation coefficient (R) of -0.313 and weighted average of 1.6%. Similarly, the statistical analysis conducted on geographies consisting of 149,360,708 people shows a poor negative correlation between the proportion of Immigrants from Belarus and percentage of population with no schooling in the United States with a correlation coefficient (R) of -0.129 and weighted average of 2.1%, a difference of 28.5%.
No Schooling Completed Correlation Summary
| Measurement | Maltese | Immigrants from Belarus |
| Minimum | 0.11% | 0.035% |
| Maximum | 2.3% | 4.6% |
| Range | 2.2% | 4.6% |
| Mean | 1.1% | 1.7% |
| Median | 1.1% | 1.6% |
| Interquartile 25% (IQ1) | 0.70% | 0.89% |
| Interquartile 75% (IQ3) | 1.5% | 2.3% |
| Interquartile Range (IQR) | 0.80% | 1.4% |
| Standard Deviation (Sample) | 0.54% | 1.00% |
| Standard Deviation (Population) | 0.53% | 0.99% |
Similar Demographics by No Schooling Completed
Demographics Similar to Maltese by No Schooling Completed
In terms of no schooling completed, the demographic groups most similar to Maltese are Czechoslovakian (1.6%, a difference of 0.090%), Estonian (1.6%, a difference of 0.13%), Ottawa (1.6%, a difference of 0.14%), Australian (1.6%, a difference of 0.32%), and Immigrants from Scotland (1.6%, a difference of 0.40%).
| Demographics | Rating | Rank | No Schooling Completed |
| Native Hawaiians | 99.9 /100 | #39 | Exceptional 1.6% |
| Luxembourgers | 99.9 /100 | #40 | Exceptional 1.6% |
| Hungarians | 99.9 /100 | #41 | Exceptional 1.6% |
| Bulgarians | 99.9 /100 | #42 | Exceptional 1.6% |
| Australians | 99.9 /100 | #43 | Exceptional 1.6% |
| Estonians | 99.9 /100 | #44 | Exceptional 1.6% |
| Czechoslovakians | 99.9 /100 | #45 | Exceptional 1.6% |
| Maltese | 99.9 /100 | #46 | Exceptional 1.6% |
| Ottawa | 99.9 /100 | #47 | Exceptional 1.6% |
| Immigrants | Scotland | 99.9 /100 | #48 | Exceptional 1.6% |
| Whites/Caucasians | 99.9 /100 | #49 | Exceptional 1.6% |
| Celtics | 99.9 /100 | #50 | Exceptional 1.6% |
| Chippewa | 99.8 /100 | #51 | Exceptional 1.6% |
| Immigrants | Canada | 99.8 /100 | #52 | Exceptional 1.6% |
| Creek | 99.8 /100 | #53 | Exceptional 1.6% |
Demographics Similar to Immigrants from Belarus by No Schooling Completed
In terms of no schooling completed, the demographic groups most similar to Immigrants from Belarus are Immigrants from Argentina (2.1%, a difference of 0.13%), Immigrants from Micronesia (2.1%, a difference of 0.24%), Immigrants from Poland (2.1%, a difference of 0.46%), Argentinean (2.1%, a difference of 0.58%), and Apache (2.1%, a difference of 0.67%).
| Demographics | Rating | Rank | No Schooling Completed |
| Dutch West Indians | 59.9 /100 | #166 | Average 2.1% |
| Egyptians | 59.2 /100 | #167 | Average 2.1% |
| Cheyenne | 58.6 /100 | #168 | Average 2.1% |
| Apache | 56.7 /100 | #169 | Average 2.1% |
| Argentineans | 56.0 /100 | #170 | Average 2.1% |
| Immigrants | Poland | 55.2 /100 | #171 | Average 2.1% |
| Immigrants | Argentina | 52.7 /100 | #172 | Average 2.1% |
| Immigrants | Belarus | 51.8 /100 | #173 | Average 2.1% |
| Immigrants | Micronesia | 50.0 /100 | #174 | Average 2.1% |
| Arabs | 46.4 /100 | #175 | Average 2.1% |
| Panamanians | 45.2 /100 | #176 | Average 2.1% |
| Arapaho | 45.0 /100 | #177 | Average 2.1% |
| Pakistanis | 44.7 /100 | #178 | Average 2.1% |
| Immigrants | Kazakhstan | 44.3 /100 | #179 | Average 2.1% |
| Portuguese | 43.9 /100 | #180 | Average 2.1% |