Immigrants from Cambodia vs Welsh College, 1 year or more
COMPARE
Immigrants from Cambodia
Welsh
College, 1 year or more
College, 1 year or more Comparison
Immigrants from Cambodia
Welsh
55.4%
COLLEGE, 1 YEAR OR MORE
0.6/ 100
METRIC RATING
251st/ 347
METRIC RANK
59.5%
COLLEGE, 1 YEAR OR MORE
52.4/ 100
METRIC RATING
170th/ 347
METRIC RANK
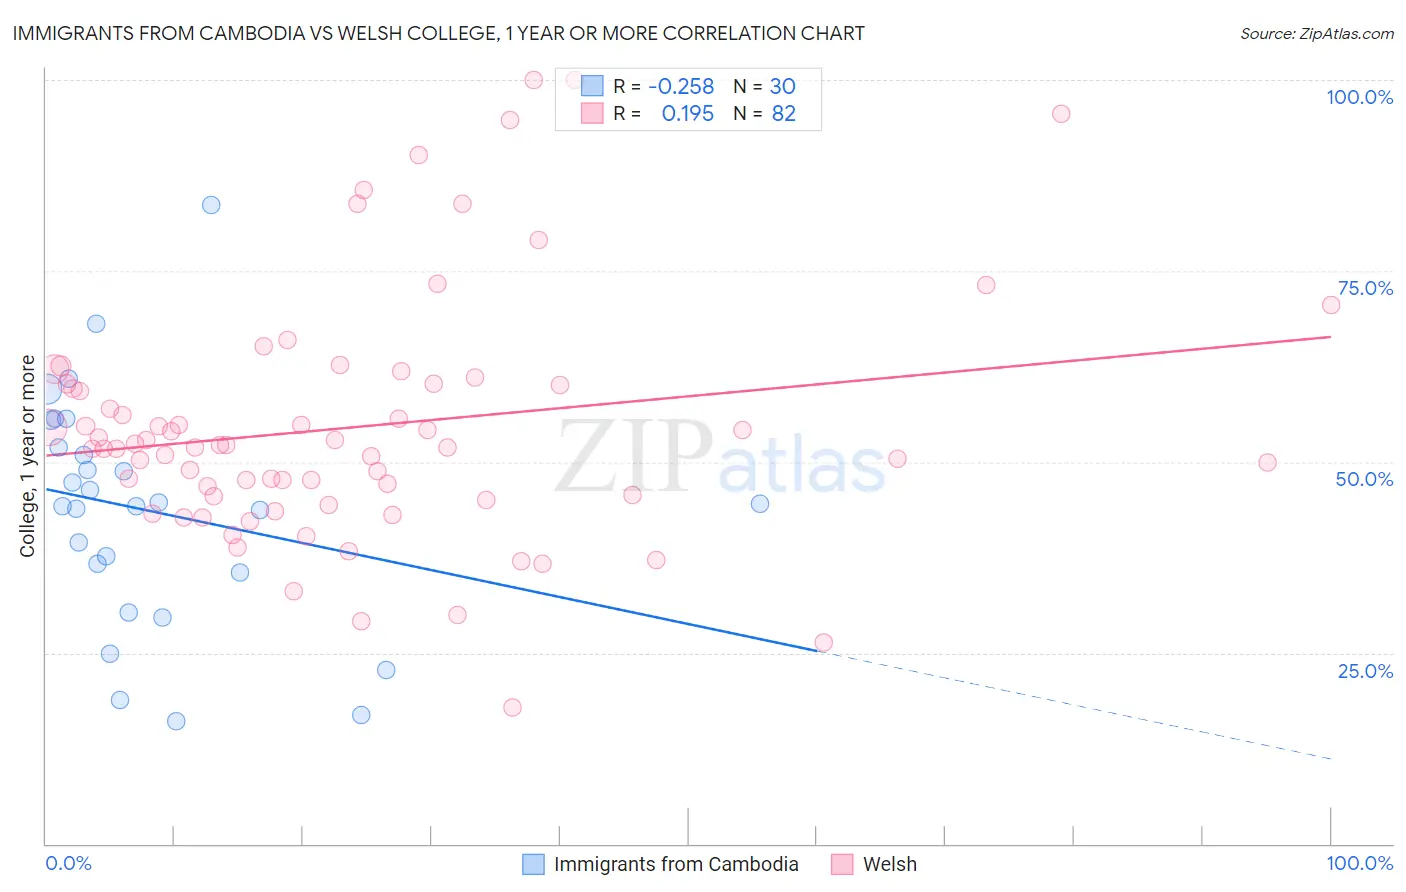
Immigrants from Cambodia vs Welsh College, 1 year or more Correlation Chart
The statistical analysis conducted on geographies consisting of 205,153,442 people shows a weak negative correlation between the proportion of Immigrants from Cambodia and percentage of population with at least college, 1 year or more education in the United States with a correlation coefficient (R) of -0.258 and weighted average of 55.4%. Similarly, the statistical analysis conducted on geographies consisting of 528,593,707 people shows a poor positive correlation between the proportion of Welsh and percentage of population with at least college, 1 year or more education in the United States with a correlation coefficient (R) of 0.195 and weighted average of 59.5%, a difference of 7.3%.
College, 1 year or more Correlation Summary
| Measurement | Immigrants from Cambodia | Welsh |
| Minimum | 16.1% | 17.8% |
| Maximum | 83.7% | 100.0% |
| Range | 67.6% | 82.2% |
| Mean | 43.5% | 54.6% |
| Median | 44.3% | 52.1% |
| Interquartile 25% (IQ1) | 35.5% | 45.5% |
| Interquartile 75% (IQ3) | 51.9% | 60.2% |
| Interquartile Range (IQR) | 16.4% | 14.7% |
| Standard Deviation (Sample) | 15.3% | 16.1% |
| Standard Deviation (Population) | 15.1% | 16.0% |
Similar Demographics by College, 1 year or more
Demographics Similar to Immigrants from Cambodia by College, 1 year or more
In terms of college, 1 year or more, the demographic groups most similar to Immigrants from Cambodia are Aleut (55.4%, a difference of 0.030%), Delaware (55.5%, a difference of 0.090%), Immigrants from Trinidad and Tobago (55.5%, a difference of 0.11%), Immigrants from Barbados (55.4%, a difference of 0.13%), and Immigrants from Congo (55.6%, a difference of 0.21%).
| Demographics | Rating | Rank | College, 1 year or more |
| Chippewa | 0.9 /100 | #244 | Tragic 55.7% |
| Immigrants | Liberia | 0.8 /100 | #245 | Tragic 55.7% |
| Malaysians | 0.8 /100 | #246 | Tragic 55.6% |
| Hawaiians | 0.8 /100 | #247 | Tragic 55.6% |
| Immigrants | Congo | 0.8 /100 | #248 | Tragic 55.6% |
| Immigrants | Trinidad and Tobago | 0.7 /100 | #249 | Tragic 55.5% |
| Delaware | 0.7 /100 | #250 | Tragic 55.5% |
| Immigrants | Cambodia | 0.6 /100 | #251 | Tragic 55.4% |
| Aleuts | 0.6 /100 | #252 | Tragic 55.4% |
| Immigrants | Barbados | 0.6 /100 | #253 | Tragic 55.4% |
| Japanese | 0.5 /100 | #254 | Tragic 55.2% |
| Immigrants | Bahamas | 0.5 /100 | #255 | Tragic 55.2% |
| Immigrants | West Indies | 0.5 /100 | #256 | Tragic 55.2% |
| Indonesians | 0.4 /100 | #257 | Tragic 55.1% |
| Africans | 0.4 /100 | #258 | Tragic 55.0% |
Demographics Similar to Welsh by College, 1 year or more
In terms of college, 1 year or more, the demographic groups most similar to Welsh are Immigrants from Albania (59.5%, a difference of 0.0%), Immigrants from Sierra Leone (59.5%, a difference of 0.010%), Immigrants from Southern Europe (59.5%, a difference of 0.020%), Hungarian (59.5%, a difference of 0.030%), and Immigrants from North Macedonia (59.5%, a difference of 0.040%).
| Demographics | Rating | Rank | College, 1 year or more |
| Immigrants | Somalia | 58.3 /100 | #163 | Average 59.7% |
| Belgians | 58.1 /100 | #164 | Average 59.7% |
| Irish | 56.1 /100 | #165 | Average 59.6% |
| Immigrants | Africa | 56.1 /100 | #166 | Average 59.6% |
| Immigrants | North Macedonia | 53.1 /100 | #167 | Average 59.5% |
| Hungarians | 52.9 /100 | #168 | Average 59.5% |
| Immigrants | Southern Europe | 52.7 /100 | #169 | Average 59.5% |
| Welsh | 52.4 /100 | #170 | Average 59.5% |
| Immigrants | Albania | 52.3 /100 | #171 | Average 59.5% |
| Immigrants | Sierra Leone | 52.2 /100 | #172 | Average 59.5% |
| Immigrants | Oceania | 51.2 /100 | #173 | Average 59.4% |
| Celtics | 50.0 /100 | #174 | Average 59.4% |
| Sri Lankans | 49.0 /100 | #175 | Average 59.4% |
| Immigrants | Poland | 48.9 /100 | #176 | Average 59.4% |
| Tlingit-Haida | 48.4 /100 | #177 | Average 59.4% |