Korean vs Swiss GED/Equivalency
COMPARE
Korean
Swiss
GED/Equivalency
GED/Equivalency Comparison
Koreans
Swiss
85.6%
GED/EQUIVALENCY
41.2/ 100
METRIC RATING
178th/ 347
METRIC RANK
87.0%
GED/EQUIVALENCY
94.5/ 100
METRIC RATING
116th/ 347
METRIC RANK
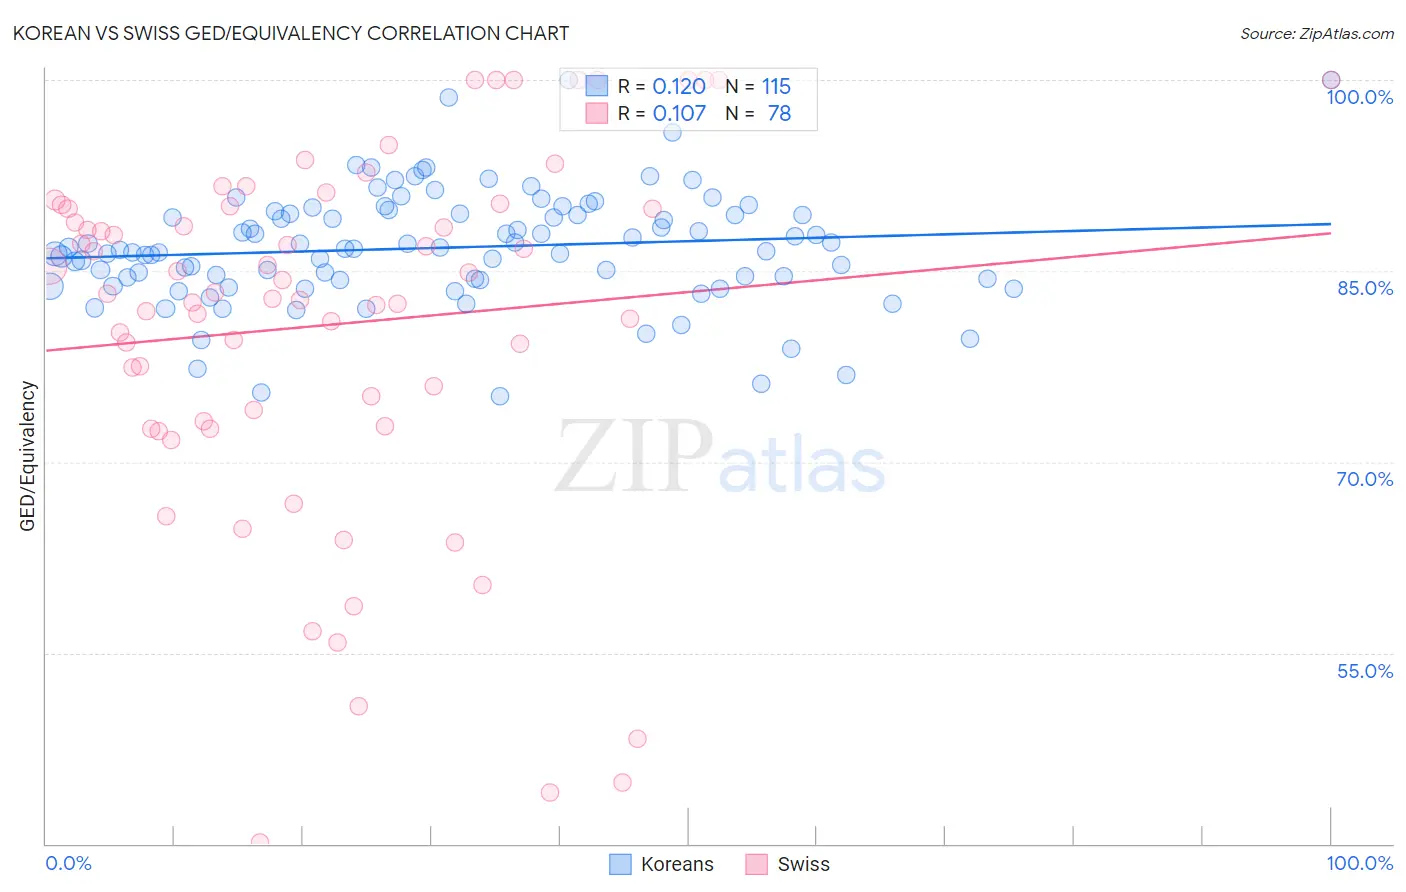
Korean vs Swiss GED/Equivalency Correlation Chart
The statistical analysis conducted on geographies consisting of 510,944,156 people shows a poor positive correlation between the proportion of Koreans and percentage of population with at least ged/equivalency education in the United States with a correlation coefficient (R) of 0.120 and weighted average of 85.6%. Similarly, the statistical analysis conducted on geographies consisting of 465,022,572 people shows a poor positive correlation between the proportion of Swiss and percentage of population with at least ged/equivalency education in the United States with a correlation coefficient (R) of 0.107 and weighted average of 87.0%, a difference of 1.7%.
GED/Equivalency Correlation Summary
| Measurement | Korean | Swiss |
| Minimum | 75.1% | 40.1% |
| Maximum | 100.0% | 100.0% |
| Range | 24.9% | 59.9% |
| Mean | 86.8% | 80.8% |
| Median | 86.8% | 83.3% |
| Interquartile 25% (IQ1) | 84.3% | 73.2% |
| Interquartile 75% (IQ3) | 89.5% | 90.1% |
| Interquartile Range (IQR) | 5.2% | 16.9% |
| Standard Deviation (Sample) | 4.5% | 14.3% |
| Standard Deviation (Population) | 4.5% | 14.2% |
Similar Demographics by GED/Equivalency
Demographics Similar to Koreans by GED/Equivalency
In terms of ged/equivalency, the demographic groups most similar to Koreans are Aleut (85.6%, a difference of 0.020%), Immigrants from Southern Europe (85.5%, a difference of 0.060%), Immigrants from Uganda (85.7%, a difference of 0.080%), Moroccan (85.5%, a difference of 0.080%), and Immigrants from Eastern Africa (85.7%, a difference of 0.13%).
| Demographics | Rating | Rank | GED/Equivalency |
| Immigrants | Chile | 57.3 /100 | #171 | Average 85.9% |
| Bermudans | 55.1 /100 | #172 | Average 85.8% |
| Immigrants | Venezuela | 50.7 /100 | #173 | Average 85.8% |
| Ottawa | 50.0 /100 | #174 | Average 85.8% |
| Immigrants | Bolivia | 49.8 /100 | #175 | Average 85.8% |
| Immigrants | Eastern Africa | 47.7 /100 | #176 | Average 85.7% |
| Immigrants | Uganda | 45.2 /100 | #177 | Average 85.7% |
| Koreans | 41.2 /100 | #178 | Average 85.6% |
| Aleuts | 40.5 /100 | #179 | Average 85.6% |
| Immigrants | Southern Europe | 38.4 /100 | #180 | Fair 85.5% |
| Moroccans | 37.7 /100 | #181 | Fair 85.5% |
| Sudanese | 35.2 /100 | #182 | Fair 85.5% |
| Immigrants | Sudan | 34.2 /100 | #183 | Fair 85.5% |
| Immigrants | Oceania | 33.6 /100 | #184 | Fair 85.5% |
| Spanish | 32.8 /100 | #185 | Fair 85.4% |
Demographics Similar to Swiss by GED/Equivalency
In terms of ged/equivalency, the demographic groups most similar to Swiss are Mongolian (87.0%, a difference of 0.010%), Immigrants from Kazakhstan (87.0%, a difference of 0.020%), Tlingit-Haida (87.0%, a difference of 0.030%), Assyrian/Chaldean/Syriac (87.0%, a difference of 0.030%), and French (87.1%, a difference of 0.070%).
| Demographics | Rating | Rank | GED/Equivalency |
| Immigrants | Eastern Europe | 95.5 /100 | #109 | Exceptional 87.1% |
| Egyptians | 95.3 /100 | #110 | Exceptional 87.1% |
| French | 95.2 /100 | #111 | Exceptional 87.1% |
| Tlingit-Haida | 94.8 /100 | #112 | Exceptional 87.0% |
| Assyrians/Chaldeans/Syriacs | 94.8 /100 | #113 | Exceptional 87.0% |
| Immigrants | Kazakhstan | 94.7 /100 | #114 | Exceptional 87.0% |
| Mongolians | 94.6 /100 | #115 | Exceptional 87.0% |
| Swiss | 94.5 /100 | #116 | Exceptional 87.0% |
| Immigrants | Hong Kong | 93.8 /100 | #117 | Exceptional 86.9% |
| French Canadians | 93.2 /100 | #118 | Exceptional 86.9% |
| Immigrants | China | 93.2 /100 | #119 | Exceptional 86.9% |
| Scotch-Irish | 91.6 /100 | #120 | Exceptional 86.8% |
| Immigrants | Lebanon | 90.9 /100 | #121 | Exceptional 86.8% |
| Immigrants | Jordan | 90.8 /100 | #122 | Exceptional 86.8% |
| Immigrants | Italy | 90.5 /100 | #123 | Exceptional 86.7% |