Immigrants from France vs South American College, 1 year or more
COMPARE
Immigrants from France
South American
College, 1 year or more
College, 1 year or more Comparison
Immigrants from France
South Americans
65.8%
COLLEGE, 1 YEAR OR MORE
100.0/ 100
METRIC RATING
28th/ 347
METRIC RANK
59.0%
COLLEGE, 1 YEAR OR MORE
35.9/ 100
METRIC RATING
185th/ 347
METRIC RANK
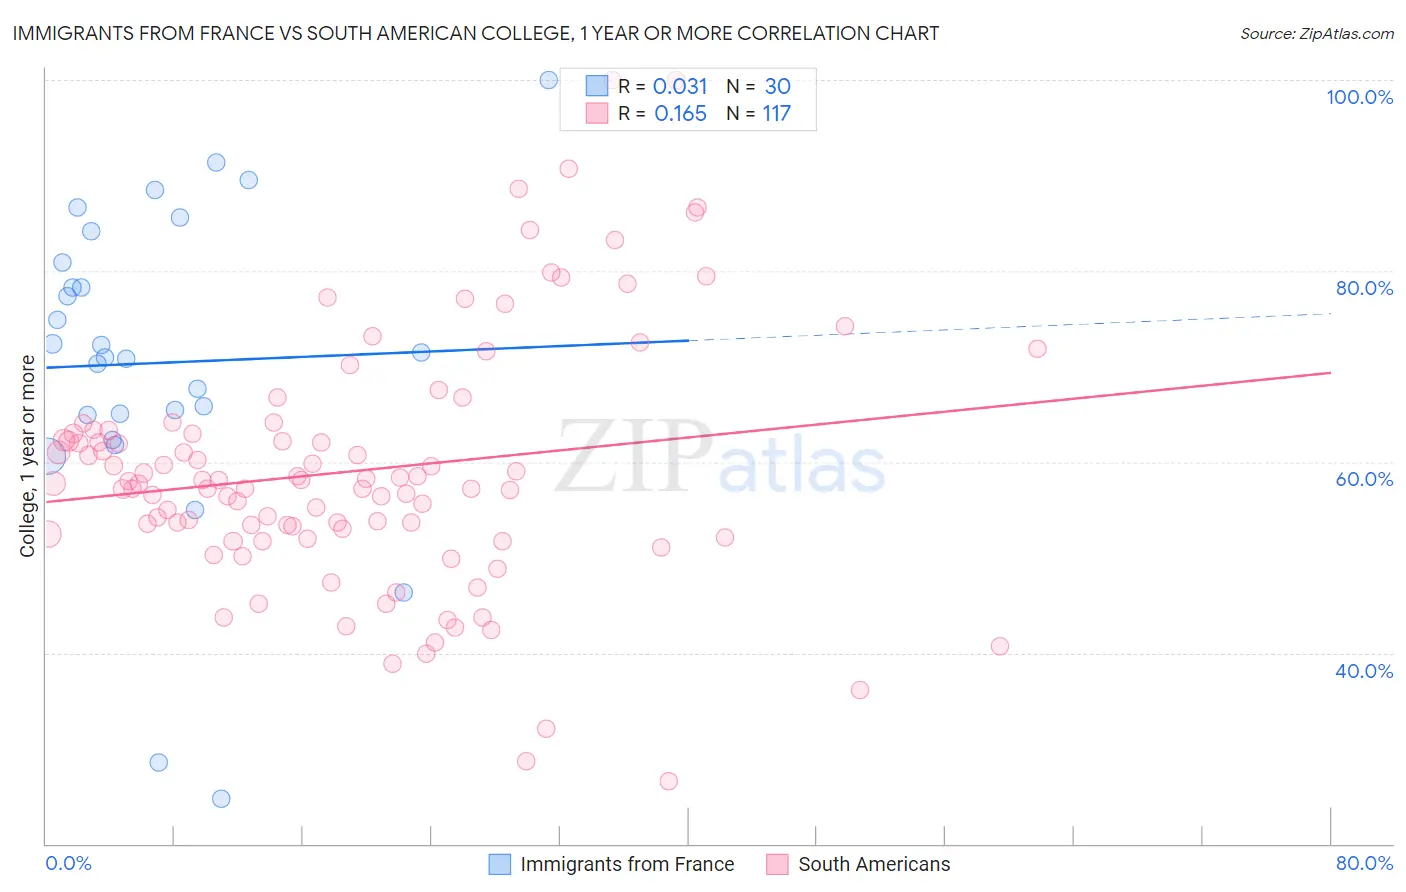
Immigrants from France vs South American College, 1 year or more Correlation Chart
The statistical analysis conducted on geographies consisting of 287,918,860 people shows no correlation between the proportion of Immigrants from France and percentage of population with at least college, 1 year or more education in the United States with a correlation coefficient (R) of 0.031 and weighted average of 65.8%. Similarly, the statistical analysis conducted on geographies consisting of 494,172,173 people shows a poor positive correlation between the proportion of South Americans and percentage of population with at least college, 1 year or more education in the United States with a correlation coefficient (R) of 0.165 and weighted average of 59.0%, a difference of 11.6%.
College, 1 year or more Correlation Summary
| Measurement | Immigrants from France | South American |
| Minimum | 24.7% | 26.5% |
| Maximum | 100.0% | 100.0% |
| Range | 75.3% | 73.5% |
| Mean | 70.4% | 59.1% |
| Median | 71.2% | 57.8% |
| Interquartile 25% (IQ1) | 64.9% | 52.2% |
| Interquartile 75% (IQ3) | 80.9% | 63.1% |
| Interquartile Range (IQR) | 16.0% | 10.9% |
| Standard Deviation (Sample) | 16.6% | 13.2% |
| Standard Deviation (Population) | 16.3% | 13.2% |
Similar Demographics by College, 1 year or more
Demographics Similar to Immigrants from France by College, 1 year or more
In terms of college, 1 year or more, the demographic groups most similar to Immigrants from France are Immigrants from Ireland (65.9%, a difference of 0.17%), Immigrants from Northern Europe (65.6%, a difference of 0.25%), Immigrants from Denmark (65.6%, a difference of 0.36%), Latvian (66.1%, a difference of 0.37%), and Indian (Asian) (66.1%, a difference of 0.41%).
| Demographics | Rating | Rank | College, 1 year or more |
| Immigrants | Hong Kong | 100.0 /100 | #21 | Exceptional 66.4% |
| Soviet Union | 100.0 /100 | #22 | Exceptional 66.4% |
| Immigrants | China | 100.0 /100 | #23 | Exceptional 66.4% |
| Immigrants | Belgium | 100.0 /100 | #24 | Exceptional 66.3% |
| Indians (Asian) | 100.0 /100 | #25 | Exceptional 66.1% |
| Latvians | 100.0 /100 | #26 | Exceptional 66.1% |
| Immigrants | Ireland | 100.0 /100 | #27 | Exceptional 65.9% |
| Immigrants | France | 100.0 /100 | #28 | Exceptional 65.8% |
| Immigrants | Northern Europe | 100.0 /100 | #29 | Exceptional 65.6% |
| Immigrants | Denmark | 100.0 /100 | #30 | Exceptional 65.6% |
| Turks | 100.0 /100 | #31 | Exceptional 65.5% |
| Bulgarians | 100.0 /100 | #32 | Exceptional 65.5% |
| Immigrants | Sri Lanka | 99.9 /100 | #33 | Exceptional 65.4% |
| Israelis | 99.9 /100 | #34 | Exceptional 65.3% |
| Immigrants | Turkey | 99.9 /100 | #35 | Exceptional 65.2% |
Demographics Similar to South Americans by College, 1 year or more
In terms of college, 1 year or more, the demographic groups most similar to South Americans are Scotch-Irish (58.9%, a difference of 0.070%), German (58.9%, a difference of 0.070%), French (58.9%, a difference of 0.090%), Spaniard (59.0%, a difference of 0.14%), and German Russian (59.1%, a difference of 0.20%).
| Demographics | Rating | Rank | College, 1 year or more |
| Czechoslovakians | 48.3 /100 | #178 | Average 59.4% |
| Bermudans | 46.6 /100 | #179 | Average 59.3% |
| Yugoslavians | 44.1 /100 | #180 | Average 59.2% |
| Swiss | 43.4 /100 | #181 | Average 59.2% |
| Immigrants | Bosnia and Herzegovina | 42.8 /100 | #182 | Average 59.2% |
| German Russians | 39.3 /100 | #183 | Fair 59.1% |
| Spaniards | 38.3 /100 | #184 | Fair 59.0% |
| South Americans | 35.9 /100 | #185 | Fair 59.0% |
| Scotch-Irish | 34.7 /100 | #186 | Fair 58.9% |
| Germans | 34.7 /100 | #187 | Fair 58.9% |
| French | 34.4 /100 | #188 | Fair 58.9% |
| Uruguayans | 31.8 /100 | #189 | Fair 58.8% |
| Immigrants | Cameroon | 31.2 /100 | #190 | Fair 58.8% |
| Immigrants | Philippines | 29.2 /100 | #191 | Fair 58.7% |
| Colombians | 27.6 /100 | #192 | Fair 58.7% |