Slavic vs Immigrants from Scotland No Schooling Completed
COMPARE
Slavic
Immigrants from Scotland
No Schooling Completed
No Schooling Completed Comparison
Slavs
Immigrants from Scotland
1.7%
NO SCHOOLING COMPLETED
99.8/ 100
METRIC RATING
59th/ 347
METRIC RANK
1.6%
NO SCHOOLING COMPLETED
99.9/ 100
METRIC RATING
48th/ 347
METRIC RANK
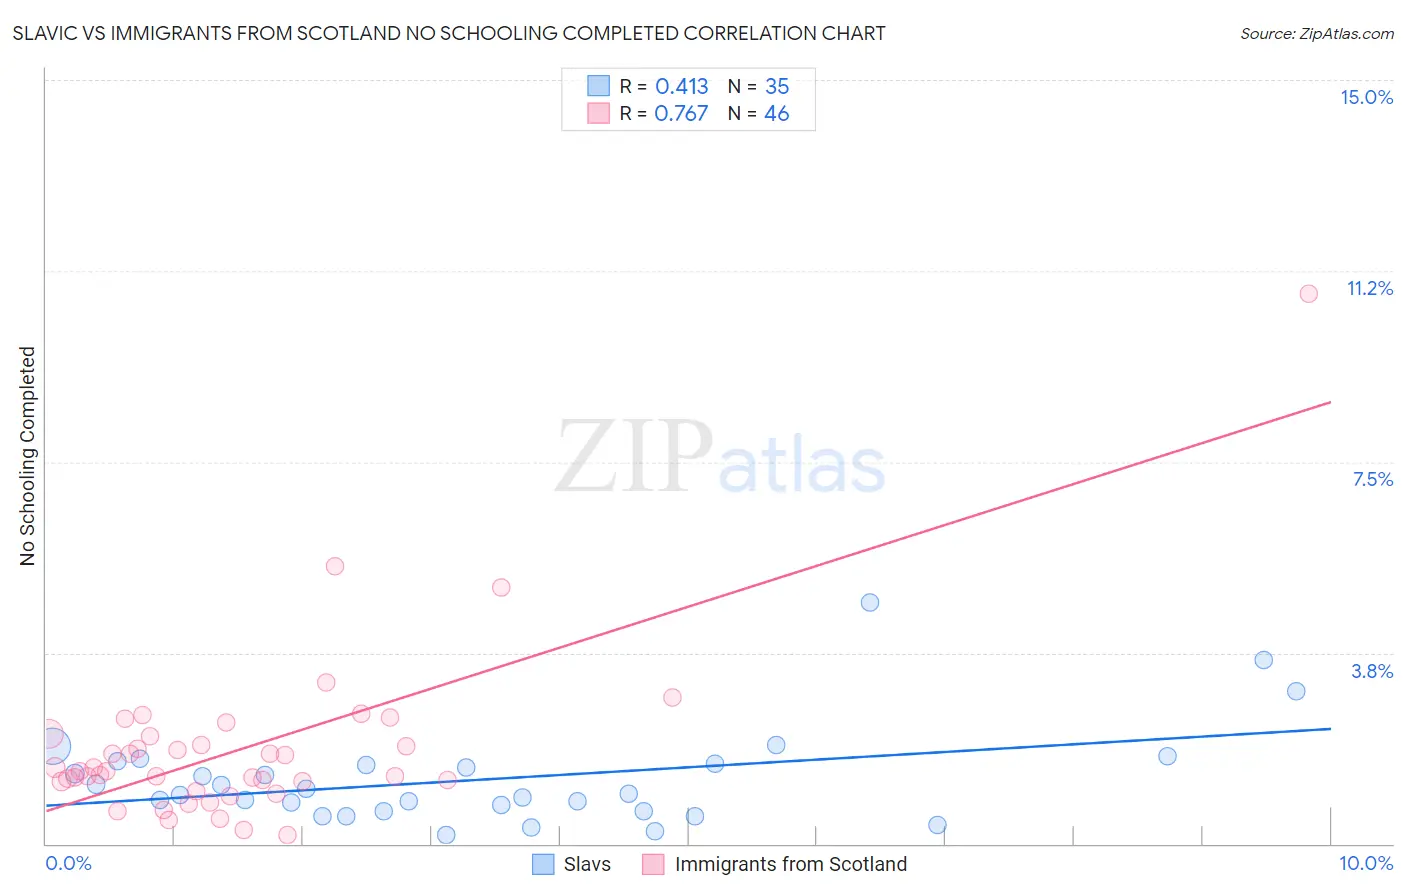
Slavic vs Immigrants from Scotland No Schooling Completed Correlation Chart
The statistical analysis conducted on geographies consisting of 268,525,041 people shows a moderate positive correlation between the proportion of Slavs and percentage of population with no schooling in the United States with a correlation coefficient (R) of 0.413 and weighted average of 1.7%. Similarly, the statistical analysis conducted on geographies consisting of 195,168,886 people shows a strong positive correlation between the proportion of Immigrants from Scotland and percentage of population with no schooling in the United States with a correlation coefficient (R) of 0.767 and weighted average of 1.6%, a difference of 1.3%.
No Schooling Completed Correlation Summary
| Measurement | Slavic | Immigrants from Scotland |
| Minimum | 0.17% | 0.17% |
| Maximum | 4.7% | 10.8% |
| Range | 4.6% | 10.6% |
| Mean | 1.3% | 1.9% |
| Median | 0.98% | 1.4% |
| Interquartile 25% (IQ1) | 0.64% | 1.2% |
| Interquartile 75% (IQ3) | 1.6% | 2.1% |
| Interquartile Range (IQR) | 0.93% | 0.90% |
| Standard Deviation (Sample) | 0.94% | 1.7% |
| Standard Deviation (Population) | 0.93% | 1.7% |
Demographics Similar to Slavs and Immigrants from Scotland by No Schooling Completed
In terms of no schooling completed, the demographic groups most similar to Slavs are Kiowa (1.6%, a difference of 0.070%), American (1.7%, a difference of 0.12%), Austrian (1.6%, a difference of 0.23%), Tsimshian (1.7%, a difference of 0.42%), and Greek (1.6%, a difference of 0.54%). Similarly, the demographic groups most similar to Immigrants from Scotland are White/Caucasian (1.6%, a difference of 0.060%), Celtic (1.6%, a difference of 0.19%), Ottawa (1.6%, a difference of 0.26%), Chippewa (1.6%, a difference of 0.39%), and Maltese (1.6%, a difference of 0.40%).
| Demographics | Rating | Rank | No Schooling Completed |
| Australians | 99.9 /100 | #43 | Exceptional 1.6% |
| Estonians | 99.9 /100 | #44 | Exceptional 1.6% |
| Czechoslovakians | 99.9 /100 | #45 | Exceptional 1.6% |
| Maltese | 99.9 /100 | #46 | Exceptional 1.6% |
| Ottawa | 99.9 /100 | #47 | Exceptional 1.6% |
| Immigrants | Scotland | 99.9 /100 | #48 | Exceptional 1.6% |
| Whites/Caucasians | 99.9 /100 | #49 | Exceptional 1.6% |
| Celtics | 99.9 /100 | #50 | Exceptional 1.6% |
| Chippewa | 99.8 /100 | #51 | Exceptional 1.6% |
| Immigrants | Canada | 99.8 /100 | #52 | Exceptional 1.6% |
| Creek | 99.8 /100 | #53 | Exceptional 1.6% |
| Crow | 99.8 /100 | #54 | Exceptional 1.6% |
| Greeks | 99.8 /100 | #55 | Exceptional 1.6% |
| Immigrants | North America | 99.8 /100 | #56 | Exceptional 1.6% |
| Austrians | 99.8 /100 | #57 | Exceptional 1.6% |
| Kiowa | 99.8 /100 | #58 | Exceptional 1.6% |
| Slavs | 99.8 /100 | #59 | Exceptional 1.7% |
| Americans | 99.8 /100 | #60 | Exceptional 1.7% |
| Tsimshian | 99.8 /100 | #61 | Exceptional 1.7% |
| Immigrants | Northern Europe | 99.8 /100 | #62 | Exceptional 1.7% |
| Russians | 99.8 /100 | #63 | Exceptional 1.7% |