Yup'ik vs Immigrants from Iran No Schooling Completed
COMPARE
Yup'ik
Immigrants from Iran
No Schooling Completed
No Schooling Completed Comparison
Yup'ik
Immigrants from Iran
1.2%
NO SCHOOLING COMPLETED
100.0/ 100
METRIC RATING
1st/ 347
METRIC RANK
2.0%
NO SCHOOLING COMPLETED
79.0/ 100
METRIC RATING
145th/ 347
METRIC RANK
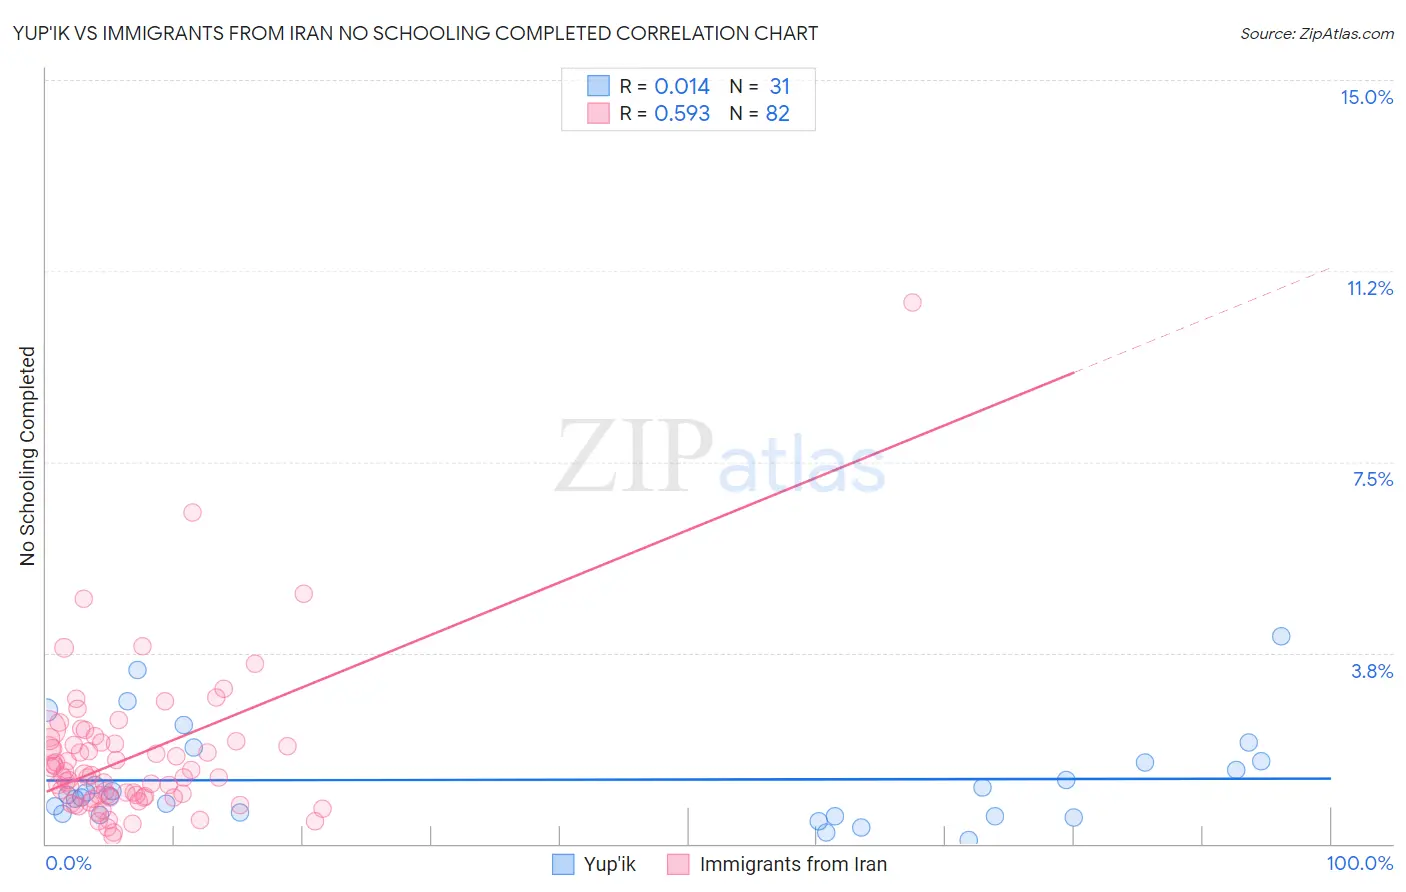
Yup'ik vs Immigrants from Iran No Schooling Completed Correlation Chart
The statistical analysis conducted on geographies consisting of 39,712,568 people shows no correlation between the proportion of Yup'ik and percentage of population with no schooling in the United States with a correlation coefficient (R) of 0.014 and weighted average of 1.2%. Similarly, the statistical analysis conducted on geographies consisting of 278,243,234 people shows a substantial positive correlation between the proportion of Immigrants from Iran and percentage of population with no schooling in the United States with a correlation coefficient (R) of 0.593 and weighted average of 2.0%, a difference of 62.4%.
No Schooling Completed Correlation Summary
| Measurement | Yup'ik | Immigrants from Iran |
| Minimum | 0.071% | 0.14% |
| Maximum | 4.1% | 10.6% |
| Range | 4.0% | 10.5% |
| Mean | 1.3% | 1.7% |
| Median | 0.95% | 1.3% |
| Interquartile 25% (IQ1) | 0.55% | 0.91% |
| Interquartile 75% (IQ3) | 1.6% | 2.0% |
| Interquartile Range (IQR) | 1.1% | 1.1% |
| Standard Deviation (Sample) | 0.95% | 1.5% |
| Standard Deviation (Population) | 0.94% | 1.5% |
Similar Demographics by No Schooling Completed
Demographics Similar to Yup'ik by No Schooling Completed
In terms of no schooling completed, the demographic groups most similar to Yup'ik are Slovak (1.3%, a difference of 9.1%), Norwegian (1.3%, a difference of 9.6%), German (1.4%, a difference of 10.2%), Slovene (1.4%, a difference of 10.7%), and Carpatho Rusyn (1.4%, a difference of 11.6%).
| Demographics | Rating | Rank | No Schooling Completed |
| Yup'ik | 100.0 /100 | #1 | Exceptional 1.2% |
| Slovaks | 100.0 /100 | #2 | Exceptional 1.3% |
| Norwegians | 100.0 /100 | #3 | Exceptional 1.3% |
| Germans | 100.0 /100 | #4 | Exceptional 1.4% |
| Slovenes | 100.0 /100 | #5 | Exceptional 1.4% |
| Carpatho Rusyns | 100.0 /100 | #6 | Exceptional 1.4% |
| English | 100.0 /100 | #7 | Exceptional 1.4% |
| Swedes | 100.0 /100 | #8 | Exceptional 1.4% |
| Scottish | 100.0 /100 | #9 | Exceptional 1.4% |
| Dutch | 100.0 /100 | #10 | Exceptional 1.4% |
| Lithuanians | 100.0 /100 | #11 | Exceptional 1.4% |
| Irish | 100.0 /100 | #12 | Exceptional 1.4% |
| Poles | 100.0 /100 | #13 | Exceptional 1.4% |
| Scotch-Irish | 100.0 /100 | #14 | Exceptional 1.5% |
| Tlingit-Haida | 100.0 /100 | #15 | Exceptional 1.5% |
Demographics Similar to Immigrants from Iran by No Schooling Completed
In terms of no schooling completed, the demographic groups most similar to Immigrants from Iran are Alsatian (2.0%, a difference of 0.010%), Immigrants from South Central Asia (2.0%, a difference of 0.21%), Immigrants from Moldova (2.0%, a difference of 0.21%), Soviet Union (2.0%, a difference of 0.39%), and Shoshone (2.0%, a difference of 0.47%).
| Demographics | Rating | Rank | No Schooling Completed |
| Immigrants | Israel | 85.4 /100 | #138 | Excellent 2.0% |
| Jordanians | 84.5 /100 | #139 | Excellent 2.0% |
| Marshallese | 83.5 /100 | #140 | Excellent 2.0% |
| Immigrants | Greece | 83.5 /100 | #141 | Excellent 2.0% |
| Venezuelans | 81.5 /100 | #142 | Excellent 2.0% |
| Immigrants | South Central Asia | 80.0 /100 | #143 | Good 2.0% |
| Alsatians | 79.1 /100 | #144 | Good 2.0% |
| Immigrants | Iran | 79.0 /100 | #145 | Good 2.0% |
| Immigrants | Moldova | 78.0 /100 | #146 | Good 2.0% |
| Soviet Union | 77.1 /100 | #147 | Good 2.0% |
| Shoshone | 76.7 /100 | #148 | Good 2.0% |
| Immigrants | North Macedonia | 75.9 /100 | #149 | Good 2.0% |
| Blackfeet | 72.9 /100 | #150 | Good 2.0% |
| Immigrants | Jordan | 70.9 /100 | #151 | Good 2.0% |
| Immigrants | Eastern Europe | 70.4 /100 | #152 | Good 2.0% |