Immigrants from Europe vs Immigrants from Iran No Schooling Completed
COMPARE
Immigrants from Europe
Immigrants from Iran
No Schooling Completed
No Schooling Completed Comparison
Immigrants from Europe
Immigrants from Iran
1.9%
NO SCHOOLING COMPLETED
93.7/ 100
METRIC RATING
125th/ 347
METRIC RANK
2.0%
NO SCHOOLING COMPLETED
79.0/ 100
METRIC RATING
145th/ 347
METRIC RANK
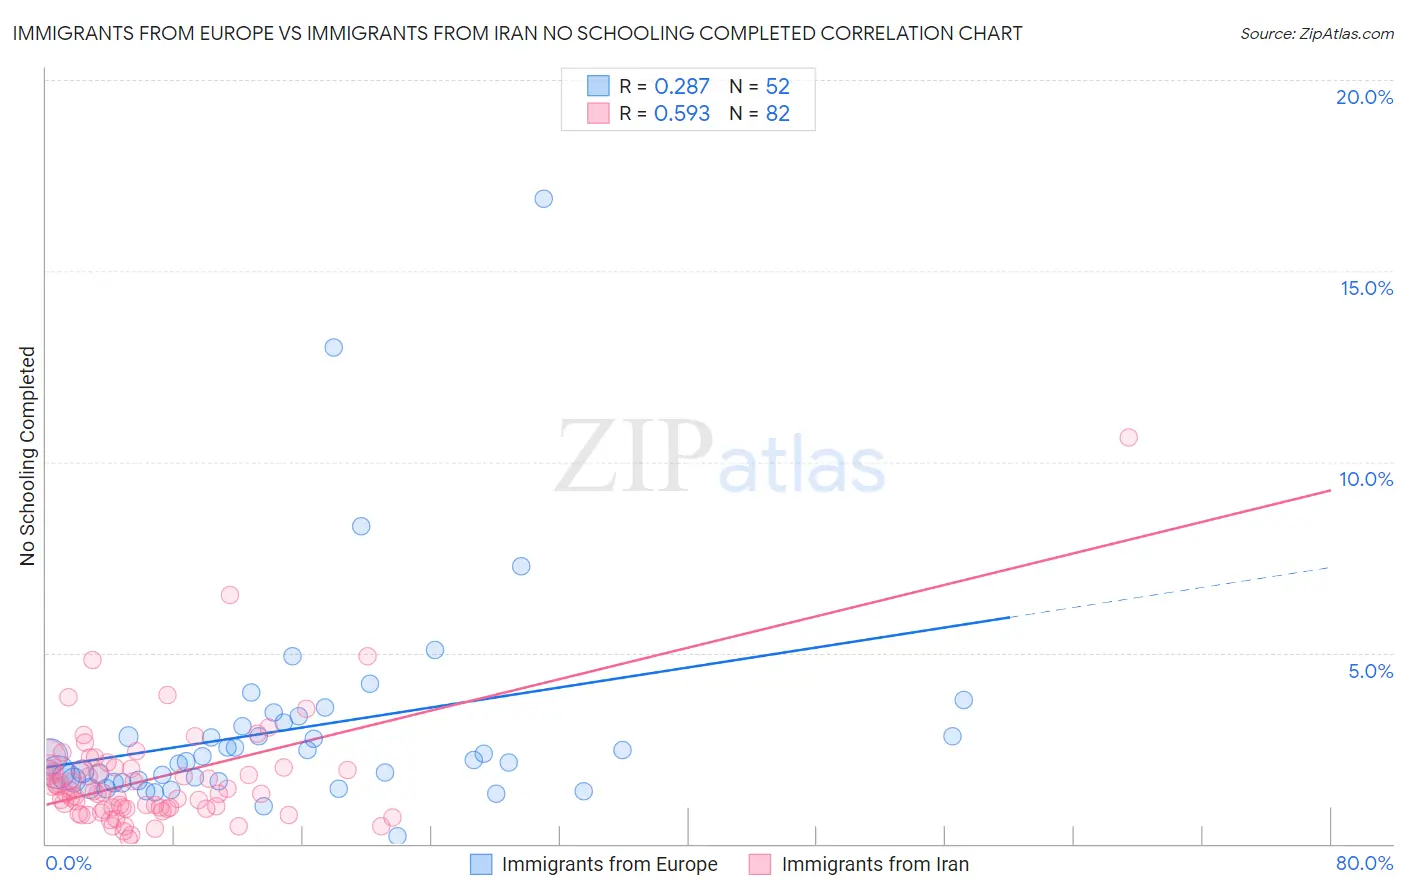
Immigrants from Europe vs Immigrants from Iran No Schooling Completed Correlation Chart
The statistical analysis conducted on geographies consisting of 533,582,074 people shows a weak positive correlation between the proportion of Immigrants from Europe and percentage of population with no schooling in the United States with a correlation coefficient (R) of 0.287 and weighted average of 1.9%. Similarly, the statistical analysis conducted on geographies consisting of 278,243,234 people shows a substantial positive correlation between the proportion of Immigrants from Iran and percentage of population with no schooling in the United States with a correlation coefficient (R) of 0.593 and weighted average of 2.0%, a difference of 5.0%.
No Schooling Completed Correlation Summary
| Measurement | Immigrants from Europe | Immigrants from Iran |
| Minimum | 0.21% | 0.14% |
| Maximum | 16.9% | 10.6% |
| Range | 16.7% | 10.5% |
| Mean | 3.0% | 1.7% |
| Median | 2.2% | 1.3% |
| Interquartile 25% (IQ1) | 1.6% | 0.91% |
| Interquartile 75% (IQ3) | 3.1% | 2.0% |
| Interquartile Range (IQR) | 1.5% | 1.1% |
| Standard Deviation (Sample) | 2.8% | 1.5% |
| Standard Deviation (Population) | 2.8% | 1.5% |
Demographics Similar to Immigrants from Europe and Immigrants from Iran by No Schooling Completed
In terms of no schooling completed, the demographic groups most similar to Immigrants from Europe are Immigrants from Romania (1.9%, a difference of 0.63%), Israeli (1.9%, a difference of 0.69%), Spaniard (1.9%, a difference of 0.78%), Seminole (1.9%, a difference of 0.92%), and Palestinian (1.9%, a difference of 1.0%). Similarly, the demographic groups most similar to Immigrants from Iran are Alsatian (2.0%, a difference of 0.010%), Immigrants from South Central Asia (2.0%, a difference of 0.21%), Venezuelan (2.0%, a difference of 0.55%), Immigrants from Greece (2.0%, a difference of 1.1%), and Marshallese (2.0%, a difference of 1.1%).
| Demographics | Rating | Rank | No Schooling Completed |
| Immigrants | Europe | 93.7 /100 | #125 | Exceptional 1.9% |
| Immigrants | Romania | 92.6 /100 | #126 | Exceptional 1.9% |
| Israelis | 92.4 /100 | #127 | Exceptional 1.9% |
| Spaniards | 92.3 /100 | #128 | Exceptional 1.9% |
| Seminole | 92.0 /100 | #129 | Exceptional 1.9% |
| Palestinians | 91.8 /100 | #130 | Exceptional 1.9% |
| Immigrants | Hungary | 91.6 /100 | #131 | Exceptional 1.9% |
| Colville | 90.4 /100 | #132 | Exceptional 1.9% |
| Immigrants | Turkey | 90.2 /100 | #133 | Exceptional 1.9% |
| Menominee | 89.6 /100 | #134 | Excellent 1.9% |
| Hmong | 88.5 /100 | #135 | Excellent 1.9% |
| Burmese | 88.2 /100 | #136 | Excellent 1.9% |
| Filipinos | 85.5 /100 | #137 | Excellent 2.0% |
| Immigrants | Israel | 85.4 /100 | #138 | Excellent 2.0% |
| Jordanians | 84.5 /100 | #139 | Excellent 2.0% |
| Marshallese | 83.5 /100 | #140 | Excellent 2.0% |
| Immigrants | Greece | 83.5 /100 | #141 | Excellent 2.0% |
| Venezuelans | 81.5 /100 | #142 | Excellent 2.0% |
| Immigrants | South Central Asia | 80.0 /100 | #143 | Good 2.0% |
| Alsatians | 79.1 /100 | #144 | Good 2.0% |
| Immigrants | Iran | 79.0 /100 | #145 | Good 2.0% |