Slavic vs Immigrants from Colombia GED/Equivalency
COMPARE
Slavic
Immigrants from Colombia
GED/Equivalency
GED/Equivalency Comparison
Slavs
Immigrants from Colombia
87.7%
GED/EQUIVALENCY
98.7/ 100
METRIC RATING
77th/ 347
METRIC RANK
84.4%
GED/EQUIVALENCY
4.5/ 100
METRIC RATING
230th/ 347
METRIC RANK
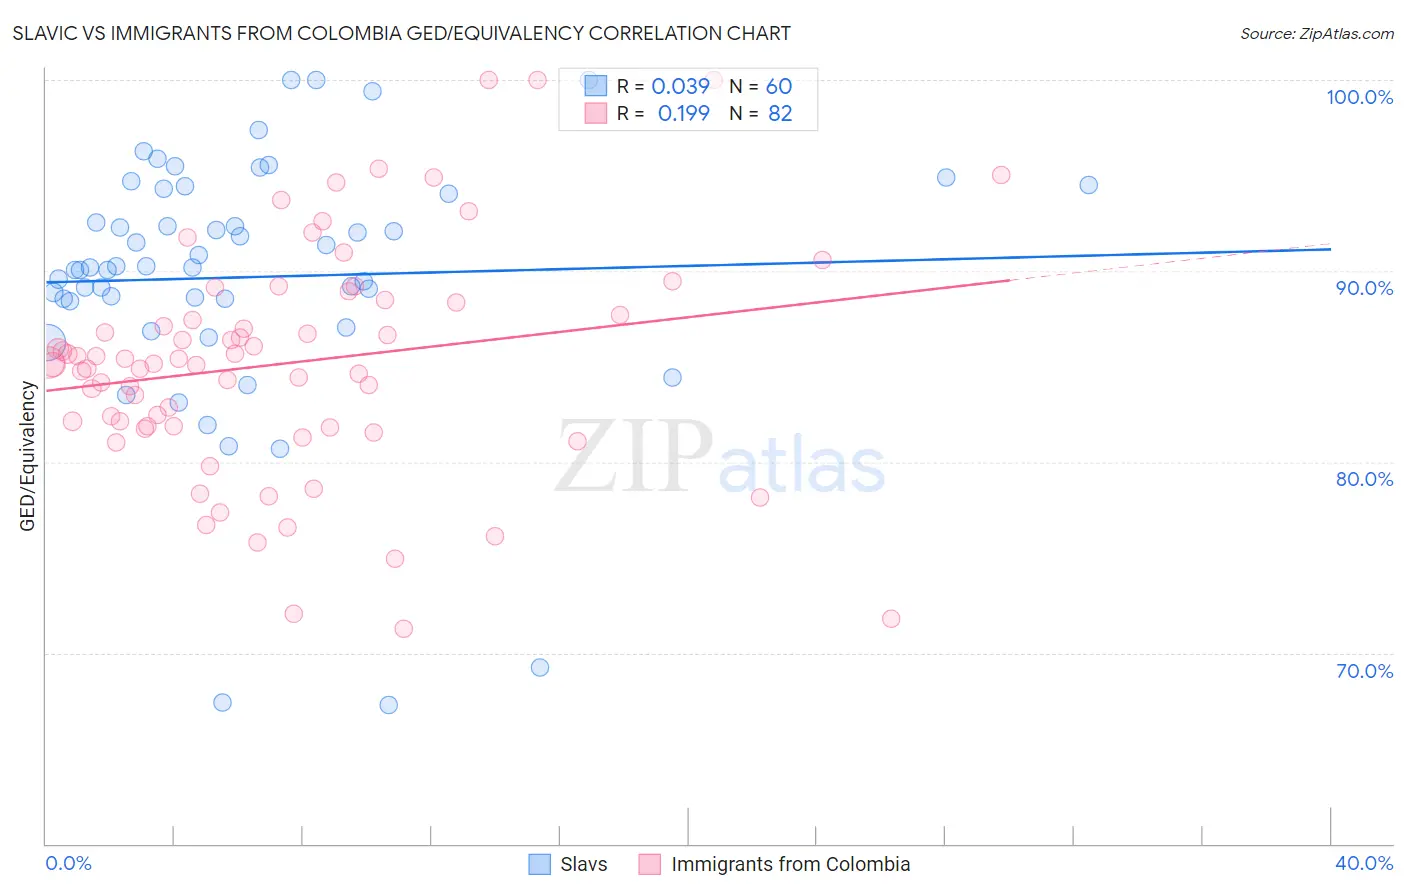
Slavic vs Immigrants from Colombia GED/Equivalency Correlation Chart
The statistical analysis conducted on geographies consisting of 270,868,774 people shows no correlation between the proportion of Slavs and percentage of population with at least ged/equivalency education in the United States with a correlation coefficient (R) of 0.039 and weighted average of 87.7%. Similarly, the statistical analysis conducted on geographies consisting of 378,643,668 people shows a poor positive correlation between the proportion of Immigrants from Colombia and percentage of population with at least ged/equivalency education in the United States with a correlation coefficient (R) of 0.199 and weighted average of 84.4%, a difference of 3.8%.
GED/Equivalency Correlation Summary
| Measurement | Slavic | Immigrants from Colombia |
| Minimum | 67.2% | 71.2% |
| Maximum | 100.0% | 100.0% |
| Range | 32.8% | 28.8% |
| Mean | 89.7% | 85.2% |
| Median | 90.2% | 85.2% |
| Interquartile 25% (IQ1) | 88.5% | 81.9% |
| Interquartile 75% (IQ3) | 94.2% | 88.4% |
| Interquartile Range (IQR) | 5.7% | 6.5% |
| Standard Deviation (Sample) | 6.7% | 6.0% |
| Standard Deviation (Population) | 6.7% | 6.0% |
Similar Demographics by GED/Equivalency
Demographics Similar to Slavs by GED/Equivalency
In terms of ged/equivalency, the demographic groups most similar to Slavs are Immigrants from Serbia (87.7%, a difference of 0.010%), Scottish (87.7%, a difference of 0.020%), Irish (87.6%, a difference of 0.020%), Immigrants from Kuwait (87.7%, a difference of 0.040%), and Belgian (87.7%, a difference of 0.050%).
| Demographics | Rating | Rank | GED/Equivalency |
| Ukrainians | 98.8 /100 | #70 | Exceptional 87.7% |
| Austrians | 98.8 /100 | #71 | Exceptional 87.7% |
| Immigrants | Moldova | 98.8 /100 | #72 | Exceptional 87.7% |
| Belgians | 98.8 /100 | #73 | Exceptional 87.7% |
| Immigrants | Kuwait | 98.8 /100 | #74 | Exceptional 87.7% |
| Scottish | 98.7 /100 | #75 | Exceptional 87.7% |
| Immigrants | Serbia | 98.7 /100 | #76 | Exceptional 87.7% |
| Slavs | 98.7 /100 | #77 | Exceptional 87.7% |
| Irish | 98.6 /100 | #78 | Exceptional 87.6% |
| English | 98.6 /100 | #79 | Exceptional 87.6% |
| Immigrants | England | 98.5 /100 | #80 | Exceptional 87.6% |
| Immigrants | Sri Lanka | 98.3 /100 | #81 | Exceptional 87.5% |
| Romanians | 98.3 /100 | #82 | Exceptional 87.5% |
| South Africans | 98.3 /100 | #83 | Exceptional 87.5% |
| Immigrants | Romania | 98.1 /100 | #84 | Exceptional 87.5% |
Demographics Similar to Immigrants from Colombia by GED/Equivalency
In terms of ged/equivalency, the demographic groups most similar to Immigrants from Colombia are Immigrants from Uruguay (84.4%, a difference of 0.010%), Immigrants from Middle Africa (84.4%, a difference of 0.030%), Immigrants from Liberia (84.4%, a difference of 0.040%), Immigrants from South America (84.4%, a difference of 0.040%), and Immigrants from Panama (84.4%, a difference of 0.050%).
| Demographics | Rating | Rank | GED/Equivalency |
| Immigrants | Uzbekistan | 7.1 /100 | #223 | Tragic 84.6% |
| French American Indians | 6.3 /100 | #224 | Tragic 84.6% |
| Immigrants | Thailand | 5.8 /100 | #225 | Tragic 84.5% |
| Immigrants | Zaire | 5.5 /100 | #226 | Tragic 84.5% |
| Immigrants | Costa Rica | 5.4 /100 | #227 | Tragic 84.5% |
| Immigrants | Liberia | 4.9 /100 | #228 | Tragic 84.4% |
| Immigrants | Uruguay | 4.6 /100 | #229 | Tragic 84.4% |
| Immigrants | Colombia | 4.5 /100 | #230 | Tragic 84.4% |
| Immigrants | Middle Africa | 4.3 /100 | #231 | Tragic 84.4% |
| Immigrants | South America | 4.2 /100 | #232 | Tragic 84.4% |
| Immigrants | Panama | 4.1 /100 | #233 | Tragic 84.4% |
| Immigrants | Nigeria | 3.6 /100 | #234 | Tragic 84.3% |
| Ghanaians | 3.5 /100 | #235 | Tragic 84.3% |
| Immigrants | Eritrea | 3.5 /100 | #236 | Tragic 84.3% |
| Sub-Saharan Africans | 3.0 /100 | #237 | Tragic 84.2% |