Uruguayan vs Immigrants from Colombia GED/Equivalency
COMPARE
Uruguayan
Immigrants from Colombia
GED/Equivalency
GED/Equivalency Comparison
Uruguayans
Immigrants from Colombia
85.0%
GED/EQUIVALENCY
16.0/ 100
METRIC RATING
200th/ 347
METRIC RANK
84.4%
GED/EQUIVALENCY
4.5/ 100
METRIC RATING
230th/ 347
METRIC RANK
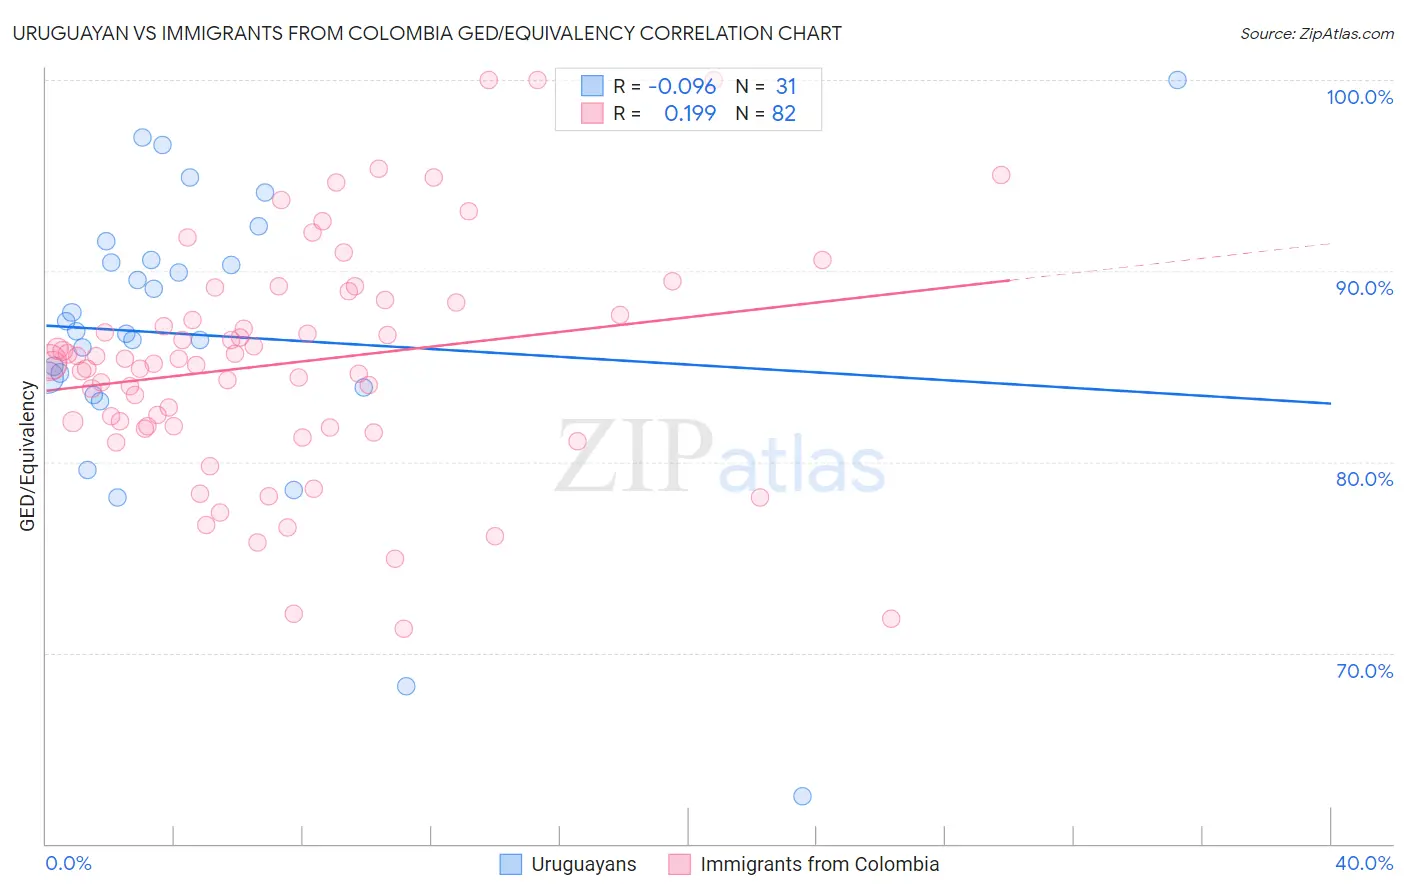
Uruguayan vs Immigrants from Colombia GED/Equivalency Correlation Chart
The statistical analysis conducted on geographies consisting of 144,782,615 people shows a slight negative correlation between the proportion of Uruguayans and percentage of population with at least ged/equivalency education in the United States with a correlation coefficient (R) of -0.096 and weighted average of 85.0%. Similarly, the statistical analysis conducted on geographies consisting of 378,643,668 people shows a poor positive correlation between the proportion of Immigrants from Colombia and percentage of population with at least ged/equivalency education in the United States with a correlation coefficient (R) of 0.199 and weighted average of 84.4%, a difference of 0.72%.
GED/Equivalency Correlation Summary
| Measurement | Uruguayan | Immigrants from Colombia |
| Minimum | 62.5% | 71.2% |
| Maximum | 100.0% | 100.0% |
| Range | 37.5% | 28.8% |
| Mean | 86.6% | 85.2% |
| Median | 86.9% | 85.2% |
| Interquartile 25% (IQ1) | 83.9% | 81.9% |
| Interquartile 75% (IQ3) | 90.5% | 88.4% |
| Interquartile Range (IQR) | 6.7% | 6.5% |
| Standard Deviation (Sample) | 7.7% | 6.0% |
| Standard Deviation (Population) | 7.6% | 6.0% |
Similar Demographics by GED/Equivalency
Demographics Similar to Uruguayans by GED/Equivalency
In terms of ged/equivalency, the demographic groups most similar to Uruguayans are Portuguese (85.0%, a difference of 0.0%), Somali (85.0%, a difference of 0.010%), Cree (85.0%, a difference of 0.010%), Panamanian (85.0%, a difference of 0.030%), and Hawaiian (85.0%, a difference of 0.030%).
| Demographics | Rating | Rank | GED/Equivalency |
| Delaware | 22.2 /100 | #193 | Fair 85.2% |
| Puget Sound Salish | 20.8 /100 | #194 | Fair 85.2% |
| Chippewa | 20.8 /100 | #195 | Fair 85.2% |
| Tongans | 20.7 /100 | #196 | Fair 85.2% |
| Costa Ricans | 20.4 /100 | #197 | Fair 85.2% |
| Immigrants | Africa | 17.5 /100 | #198 | Poor 85.1% |
| Somalis | 16.4 /100 | #199 | Poor 85.0% |
| Uruguayans | 16.0 /100 | #200 | Poor 85.0% |
| Portuguese | 15.9 /100 | #201 | Poor 85.0% |
| Cree | 15.9 /100 | #202 | Poor 85.0% |
| Panamanians | 15.3 /100 | #203 | Poor 85.0% |
| Hawaiians | 15.2 /100 | #204 | Poor 85.0% |
| Liberians | 14.6 /100 | #205 | Poor 85.0% |
| Samoans | 13.7 /100 | #206 | Poor 84.9% |
| Hmong | 13.1 /100 | #207 | Poor 84.9% |
Demographics Similar to Immigrants from Colombia by GED/Equivalency
In terms of ged/equivalency, the demographic groups most similar to Immigrants from Colombia are Immigrants from Uruguay (84.4%, a difference of 0.010%), Immigrants from Middle Africa (84.4%, a difference of 0.030%), Immigrants from Liberia (84.4%, a difference of 0.040%), Immigrants from South America (84.4%, a difference of 0.040%), and Immigrants from Panama (84.4%, a difference of 0.050%).
| Demographics | Rating | Rank | GED/Equivalency |
| Immigrants | Uzbekistan | 7.1 /100 | #223 | Tragic 84.6% |
| French American Indians | 6.3 /100 | #224 | Tragic 84.6% |
| Immigrants | Thailand | 5.8 /100 | #225 | Tragic 84.5% |
| Immigrants | Zaire | 5.5 /100 | #226 | Tragic 84.5% |
| Immigrants | Costa Rica | 5.4 /100 | #227 | Tragic 84.5% |
| Immigrants | Liberia | 4.9 /100 | #228 | Tragic 84.4% |
| Immigrants | Uruguay | 4.6 /100 | #229 | Tragic 84.4% |
| Immigrants | Colombia | 4.5 /100 | #230 | Tragic 84.4% |
| Immigrants | Middle Africa | 4.3 /100 | #231 | Tragic 84.4% |
| Immigrants | South America | 4.2 /100 | #232 | Tragic 84.4% |
| Immigrants | Panama | 4.1 /100 | #233 | Tragic 84.4% |
| Immigrants | Nigeria | 3.6 /100 | #234 | Tragic 84.3% |
| Ghanaians | 3.5 /100 | #235 | Tragic 84.3% |
| Immigrants | Eritrea | 3.5 /100 | #236 | Tragic 84.3% |
| Sub-Saharan Africans | 3.0 /100 | #237 | Tragic 84.2% |