Slavic vs Immigrants from Colombia In Labor Force | Age 20-24
COMPARE
Slavic
Immigrants from Colombia
In Labor Force | Age 20-24
In Labor Force | Age 20-24 Comparison
Slavs
Immigrants from Colombia
76.9%
IN LABOR FORCE | AGE 20-24
99.9/ 100
METRIC RATING
67th/ 347
METRIC RANK
73.4%
IN LABOR FORCE | AGE 20-24
0.2/ 100
METRIC RATING
274th/ 347
METRIC RANK
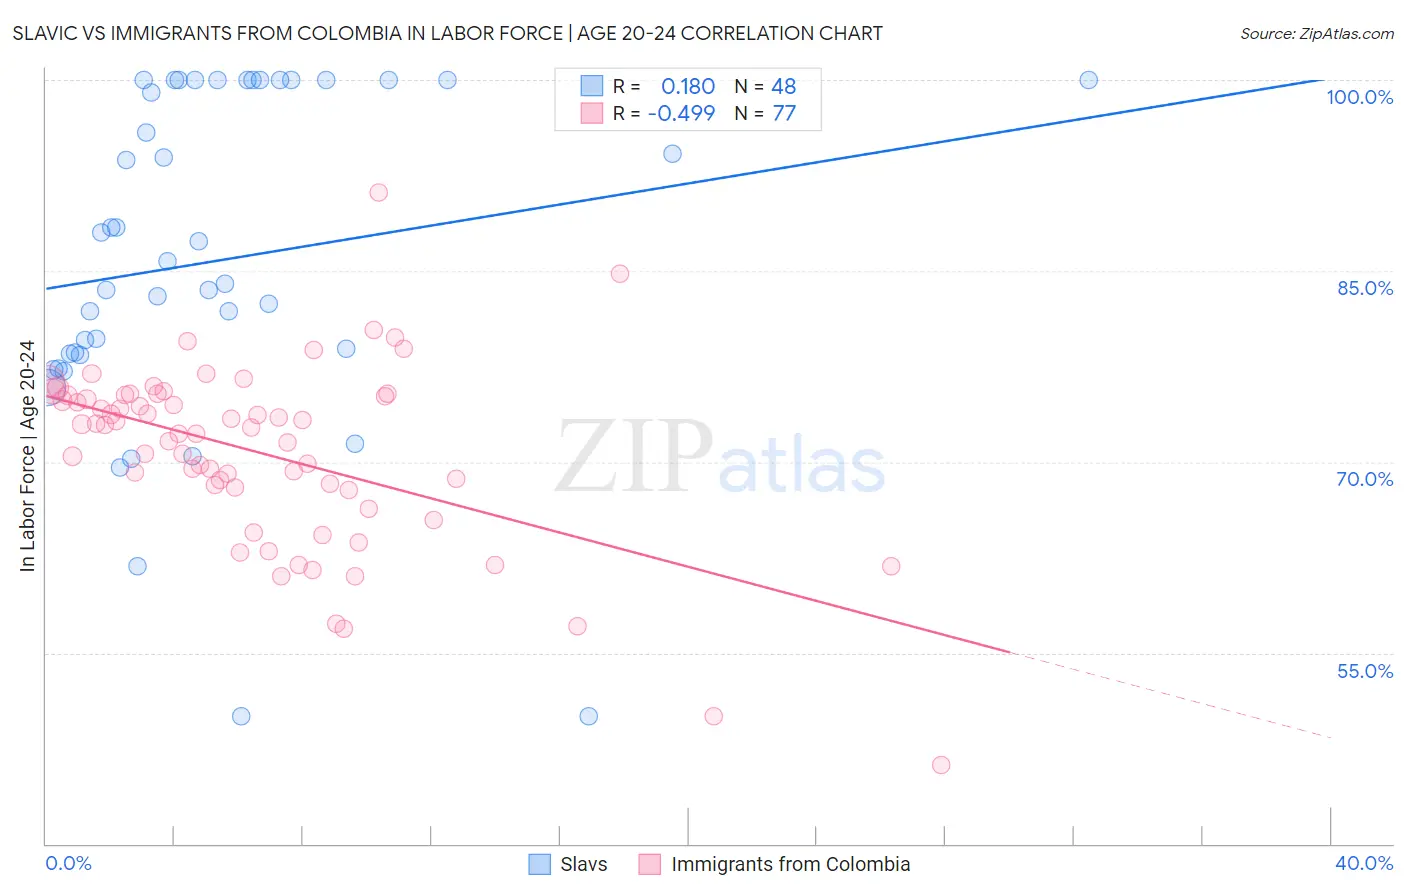
Slavic vs Immigrants from Colombia In Labor Force | Age 20-24 Correlation Chart
The statistical analysis conducted on geographies consisting of 270,816,892 people shows a poor positive correlation between the proportion of Slavs and labor force participation rate among population between the ages 20 and 24 in the United States with a correlation coefficient (R) of 0.180 and weighted average of 76.9%. Similarly, the statistical analysis conducted on geographies consisting of 378,565,425 people shows a moderate negative correlation between the proportion of Immigrants from Colombia and labor force participation rate among population between the ages 20 and 24 in the United States with a correlation coefficient (R) of -0.499 and weighted average of 73.4%, a difference of 4.7%.
In Labor Force | Age 20-24 Correlation Summary
| Measurement | Slavic | Immigrants from Colombia |
| Minimum | 50.0% | 46.2% |
| Maximum | 100.0% | 91.2% |
| Range | 50.0% | 45.0% |
| Mean | 85.8% | 70.7% |
| Median | 84.9% | 72.7% |
| Interquartile 25% (IQ1) | 78.5% | 67.9% |
| Interquartile 75% (IQ3) | 100.0% | 75.2% |
| Interquartile Range (IQR) | 21.5% | 7.3% |
| Standard Deviation (Sample) | 13.1% | 7.3% |
| Standard Deviation (Population) | 13.0% | 7.2% |
Similar Demographics by In Labor Force | Age 20-24
Demographics Similar to Slavs by In Labor Force | Age 20-24
In terms of in labor force | age 20-24, the demographic groups most similar to Slavs are Icelander (76.9%, a difference of 0.010%), Crow (76.9%, a difference of 0.020%), French American Indian (76.8%, a difference of 0.040%), Immigrants from Sudan (76.8%, a difference of 0.050%), and Ottawa (76.8%, a difference of 0.060%).
| Demographics | Rating | Rank | In Labor Force | Age 20-24 |
| Kenyans | 99.9 /100 | #60 | Exceptional 77.0% |
| Immigrants | Eritrea | 99.9 /100 | #61 | Exceptional 77.0% |
| Immigrants | Kenya | 99.9 /100 | #62 | Exceptional 77.0% |
| Lithuanians | 99.9 /100 | #63 | Exceptional 77.0% |
| Whites/Caucasians | 99.9 /100 | #64 | Exceptional 76.9% |
| Crow | 99.9 /100 | #65 | Exceptional 76.9% |
| Icelanders | 99.9 /100 | #66 | Exceptional 76.9% |
| Slavs | 99.9 /100 | #67 | Exceptional 76.9% |
| French American Indians | 99.8 /100 | #68 | Exceptional 76.8% |
| Immigrants | Sudan | 99.8 /100 | #69 | Exceptional 76.8% |
| Ottawa | 99.8 /100 | #70 | Exceptional 76.8% |
| Northern Europeans | 99.8 /100 | #71 | Exceptional 76.8% |
| Guamanians/Chamorros | 99.8 /100 | #72 | Exceptional 76.7% |
| British | 99.8 /100 | #73 | Exceptional 76.7% |
| Cree | 99.7 /100 | #74 | Exceptional 76.6% |
Demographics Similar to Immigrants from Colombia by In Labor Force | Age 20-24
In terms of in labor force | age 20-24, the demographic groups most similar to Immigrants from Colombia are Cheyenne (73.4%, a difference of 0.020%), Belizean (73.4%, a difference of 0.050%), Immigrants from South America (73.3%, a difference of 0.050%), Immigrants from Indonesia (73.4%, a difference of 0.060%), and Mongolian (73.3%, a difference of 0.070%).
| Demographics | Rating | Rank | In Labor Force | Age 20-24 |
| Immigrants | Western Asia | 0.4 /100 | #267 | Tragic 73.5% |
| South Americans | 0.4 /100 | #268 | Tragic 73.5% |
| Colombians | 0.3 /100 | #269 | Tragic 73.5% |
| Immigrants | Russia | 0.3 /100 | #270 | Tragic 73.5% |
| Immigrants | Indonesia | 0.3 /100 | #271 | Tragic 73.4% |
| Belizeans | 0.3 /100 | #272 | Tragic 73.4% |
| Cheyenne | 0.2 /100 | #273 | Tragic 73.4% |
| Immigrants | Colombia | 0.2 /100 | #274 | Tragic 73.4% |
| Immigrants | South America | 0.2 /100 | #275 | Tragic 73.3% |
| Mongolians | 0.2 /100 | #276 | Tragic 73.3% |
| Immigrants | Malaysia | 0.2 /100 | #277 | Tragic 73.3% |
| Cypriots | 0.2 /100 | #278 | Tragic 73.3% |
| Venezuelans | 0.2 /100 | #279 | Tragic 73.3% |
| Bahamians | 0.1 /100 | #280 | Tragic 73.3% |
| Immigrants | Venezuela | 0.1 /100 | #281 | Tragic 73.2% |