Slavic vs Immigrants from Western Europe GED/Equivalency
COMPARE
Slavic
Immigrants from Western Europe
GED/Equivalency
GED/Equivalency Comparison
Slavs
Immigrants from Western Europe
87.7%
GED/EQUIVALENCY
98.7/ 100
METRIC RATING
77th/ 347
METRIC RANK
87.3%
GED/EQUIVALENCY
97.3/ 100
METRIC RATING
97th/ 347
METRIC RANK
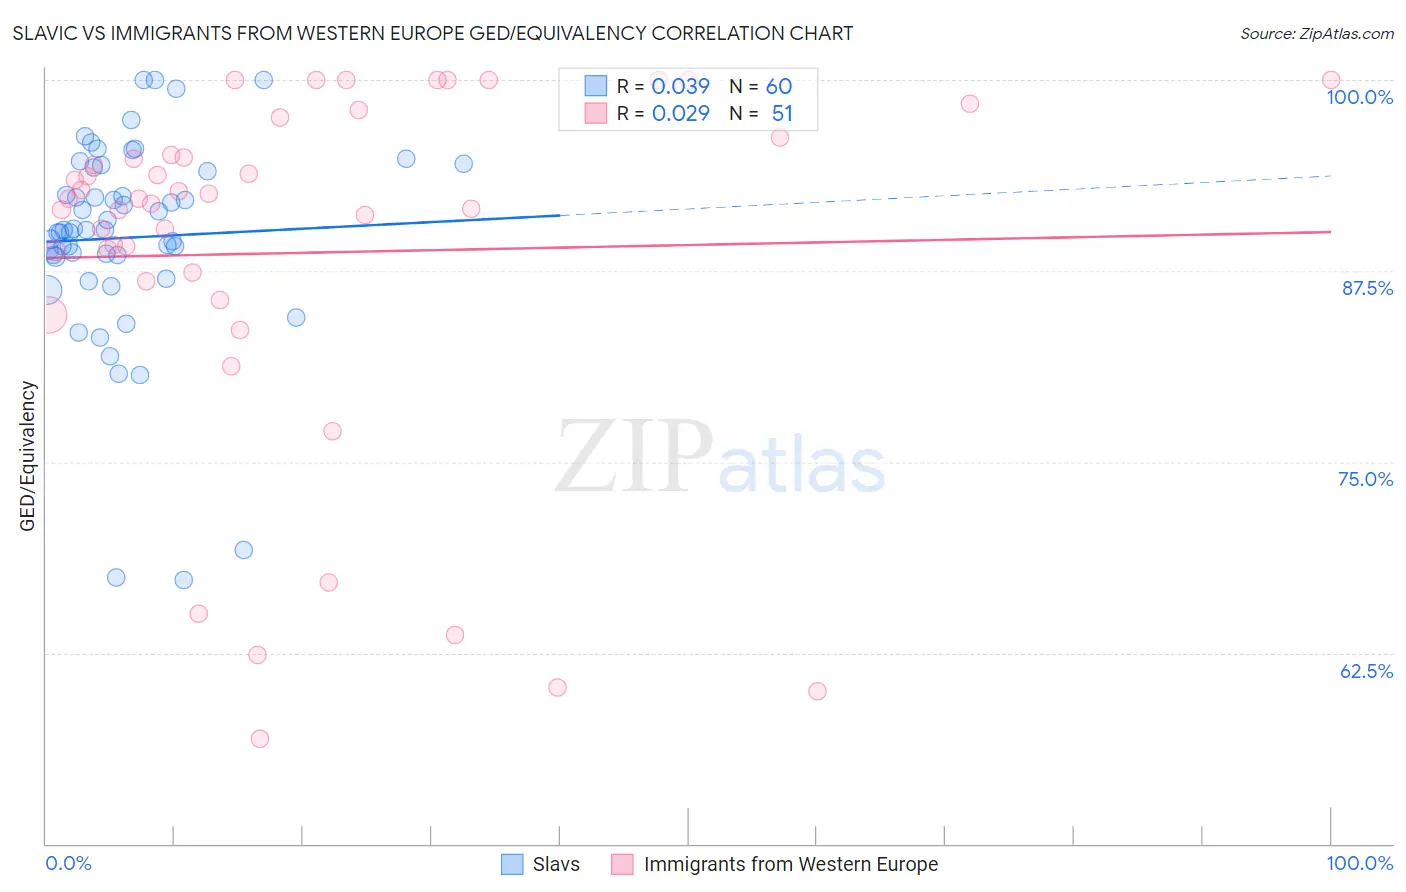
Slavic vs Immigrants from Western Europe GED/Equivalency Correlation Chart
The statistical analysis conducted on geographies consisting of 270,868,774 people shows no correlation between the proportion of Slavs and percentage of population with at least ged/equivalency education in the United States with a correlation coefficient (R) of 0.039 and weighted average of 87.7%. Similarly, the statistical analysis conducted on geographies consisting of 494,080,521 people shows no correlation between the proportion of Immigrants from Western Europe and percentage of population with at least ged/equivalency education in the United States with a correlation coefficient (R) of 0.029 and weighted average of 87.3%, a difference of 0.37%.
GED/Equivalency Correlation Summary
| Measurement | Slavic | Immigrants from Western Europe |
| Minimum | 67.2% | 56.9% |
| Maximum | 100.0% | 100.0% |
| Range | 32.8% | 43.1% |
| Mean | 89.7% | 88.7% |
| Median | 90.2% | 92.2% |
| Interquartile 25% (IQ1) | 88.5% | 86.8% |
| Interquartile 75% (IQ3) | 94.2% | 96.2% |
| Interquartile Range (IQR) | 5.7% | 9.4% |
| Standard Deviation (Sample) | 6.7% | 11.9% |
| Standard Deviation (Population) | 6.7% | 11.8% |
Demographics Similar to Slavs and Immigrants from Western Europe by GED/Equivalency
In terms of ged/equivalency, the demographic groups most similar to Slavs are Irish (87.6%, a difference of 0.020%), English (87.6%, a difference of 0.050%), Immigrants from England (87.6%, a difference of 0.080%), Immigrants from Sri Lanka (87.5%, a difference of 0.12%), and Romanian (87.5%, a difference of 0.13%). Similarly, the demographic groups most similar to Immigrants from Western Europe are Czechoslovakian (87.4%, a difference of 0.070%), Immigrants from Greece (87.4%, a difference of 0.090%), Immigrants from North Macedonia (87.4%, a difference of 0.10%), Immigrants from Russia (87.4%, a difference of 0.10%), and Israeli (87.4%, a difference of 0.11%).
| Demographics | Rating | Rank | GED/Equivalency |
| Slavs | 98.7 /100 | #77 | Exceptional 87.7% |
| Irish | 98.6 /100 | #78 | Exceptional 87.6% |
| English | 98.6 /100 | #79 | Exceptional 87.6% |
| Immigrants | England | 98.5 /100 | #80 | Exceptional 87.6% |
| Immigrants | Sri Lanka | 98.3 /100 | #81 | Exceptional 87.5% |
| Romanians | 98.3 /100 | #82 | Exceptional 87.5% |
| South Africans | 98.3 /100 | #83 | Exceptional 87.5% |
| Immigrants | Romania | 98.1 /100 | #84 | Exceptional 87.5% |
| Dutch | 98.1 /100 | #85 | Exceptional 87.5% |
| Immigrants | Europe | 98.1 /100 | #86 | Exceptional 87.5% |
| Native Hawaiians | 98.1 /100 | #87 | Exceptional 87.5% |
| Immigrants | Norway | 98.1 /100 | #88 | Exceptional 87.5% |
| Hungarians | 97.9 /100 | #89 | Exceptional 87.4% |
| Welsh | 97.9 /100 | #90 | Exceptional 87.4% |
| Immigrants | Eastern Asia | 97.9 /100 | #91 | Exceptional 87.4% |
| Israelis | 97.8 /100 | #92 | Exceptional 87.4% |
| Immigrants | North Macedonia | 97.8 /100 | #93 | Exceptional 87.4% |
| Immigrants | Russia | 97.8 /100 | #94 | Exceptional 87.4% |
| Immigrants | Greece | 97.7 /100 | #95 | Exceptional 87.4% |
| Czechoslovakians | 97.6 /100 | #96 | Exceptional 87.4% |
| Immigrants | Western Europe | 97.3 /100 | #97 | Exceptional 87.3% |