Chippewa vs Bermudan Professional Degree
COMPARE
Chippewa
Bermudan
Professional Degree
Professional Degree Comparison
Chippewa
Bermudans
3.5%
PROFESSIONAL DEGREE
0.3/ 100
METRIC RATING
290th/ 347
METRIC RANK
4.4%
PROFESSIONAL DEGREE
43.1/ 100
METRIC RATING
183rd/ 347
METRIC RANK
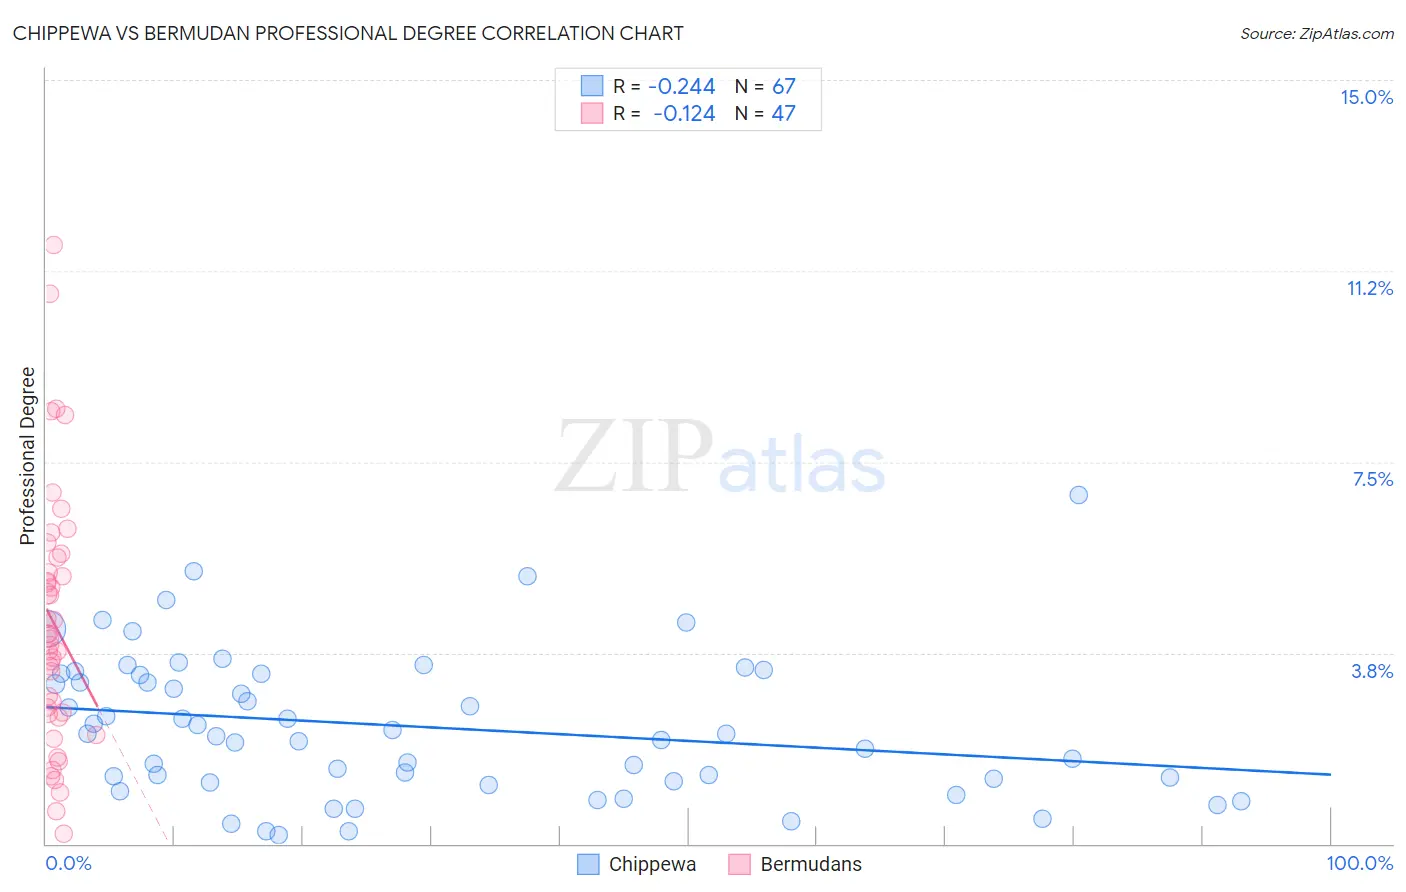
Chippewa vs Bermudan Professional Degree Correlation Chart
The statistical analysis conducted on geographies consisting of 214,425,130 people shows a weak negative correlation between the proportion of Chippewa and percentage of population with at least professional degree education in the United States with a correlation coefficient (R) of -0.244 and weighted average of 3.5%. Similarly, the statistical analysis conducted on geographies consisting of 55,708,616 people shows a poor negative correlation between the proportion of Bermudans and percentage of population with at least professional degree education in the United States with a correlation coefficient (R) of -0.124 and weighted average of 4.4%, a difference of 25.8%.
Professional Degree Correlation Summary
| Measurement | Chippewa | Bermudan |
| Minimum | 0.17% | 0.19% |
| Maximum | 6.9% | 11.8% |
| Range | 6.7% | 11.6% |
| Mean | 2.3% | 4.3% |
| Median | 2.2% | 4.0% |
| Interquartile 25% (IQ1) | 1.2% | 2.5% |
| Interquartile 75% (IQ3) | 3.3% | 5.6% |
| Interquartile Range (IQR) | 2.1% | 3.1% |
| Standard Deviation (Sample) | 1.4% | 2.5% |
| Standard Deviation (Population) | 1.4% | 2.5% |
Similar Demographics by Professional Degree
Demographics Similar to Chippewa by Professional Degree
In terms of professional degree, the demographic groups most similar to Chippewa are Guatemalan (3.5%, a difference of 0.010%), Alaska Native (3.5%, a difference of 0.17%), Blackfeet (3.5%, a difference of 0.19%), Immigrants from El Salvador (3.5%, a difference of 0.23%), and Immigrants from Belize (3.5%, a difference of 0.24%).
| Demographics | Rating | Rank | Professional Degree |
| Comanche | 0.4 /100 | #283 | Tragic 3.5% |
| Salvadorans | 0.4 /100 | #284 | Tragic 3.5% |
| Hondurans | 0.3 /100 | #285 | Tragic 3.5% |
| Haitians | 0.3 /100 | #286 | Tragic 3.5% |
| Immigrants | El Salvador | 0.3 /100 | #287 | Tragic 3.5% |
| Blackfeet | 0.3 /100 | #288 | Tragic 3.5% |
| Guatemalans | 0.3 /100 | #289 | Tragic 3.5% |
| Chippewa | 0.3 /100 | #290 | Tragic 3.5% |
| Alaska Natives | 0.3 /100 | #291 | Tragic 3.5% |
| Immigrants | Belize | 0.3 /100 | #292 | Tragic 3.5% |
| Immigrants | Honduras | 0.3 /100 | #293 | Tragic 3.5% |
| Paiute | 0.3 /100 | #294 | Tragic 3.4% |
| Immigrants | Guatemala | 0.2 /100 | #295 | Tragic 3.4% |
| Hawaiians | 0.2 /100 | #296 | Tragic 3.4% |
| Immigrants | Liberia | 0.2 /100 | #297 | Tragic 3.4% |
Demographics Similar to Bermudans by Professional Degree
In terms of professional degree, the demographic groups most similar to Bermudans are Immigrants (4.4%, a difference of 0.010%), Danish (4.4%, a difference of 0.060%), Czech (4.4%, a difference of 0.28%), Immigrants from Kenya (4.4%, a difference of 0.42%), and Immigrants from Costa Rica (4.4%, a difference of 0.53%).
| Demographics | Rating | Rank | Professional Degree |
| Immigrants | Peru | 49.3 /100 | #176 | Average 4.4% |
| Celtics | 47.6 /100 | #177 | Average 4.4% |
| Immigrants | Costa Rica | 46.7 /100 | #178 | Average 4.4% |
| Immigrants | Kenya | 45.9 /100 | #179 | Average 4.4% |
| Czechs | 44.9 /100 | #180 | Average 4.4% |
| Danes | 43.5 /100 | #181 | Average 4.4% |
| Immigrants | Immigrants | 43.2 /100 | #182 | Average 4.4% |
| Bermudans | 43.1 /100 | #183 | Average 4.4% |
| Belgians | 36.2 /100 | #184 | Fair 4.3% |
| Welsh | 35.8 /100 | #185 | Fair 4.3% |
| Scotch-Irish | 34.2 /100 | #186 | Fair 4.3% |
| Immigrants | Cameroon | 33.3 /100 | #187 | Fair 4.3% |
| Immigrants | Thailand | 31.7 /100 | #188 | Fair 4.3% |
| Slovaks | 30.7 /100 | #189 | Fair 4.3% |
| Immigrants | Poland | 29.2 /100 | #190 | Fair 4.3% |