Ugandan vs Bermudan Professional Degree
COMPARE
Ugandan
Bermudan
Professional Degree
Professional Degree Comparison
Ugandans
Bermudans
5.1%
PROFESSIONAL DEGREE
98.8/ 100
METRIC RATING
100th/ 347
METRIC RANK
4.4%
PROFESSIONAL DEGREE
43.1/ 100
METRIC RATING
183rd/ 347
METRIC RANK
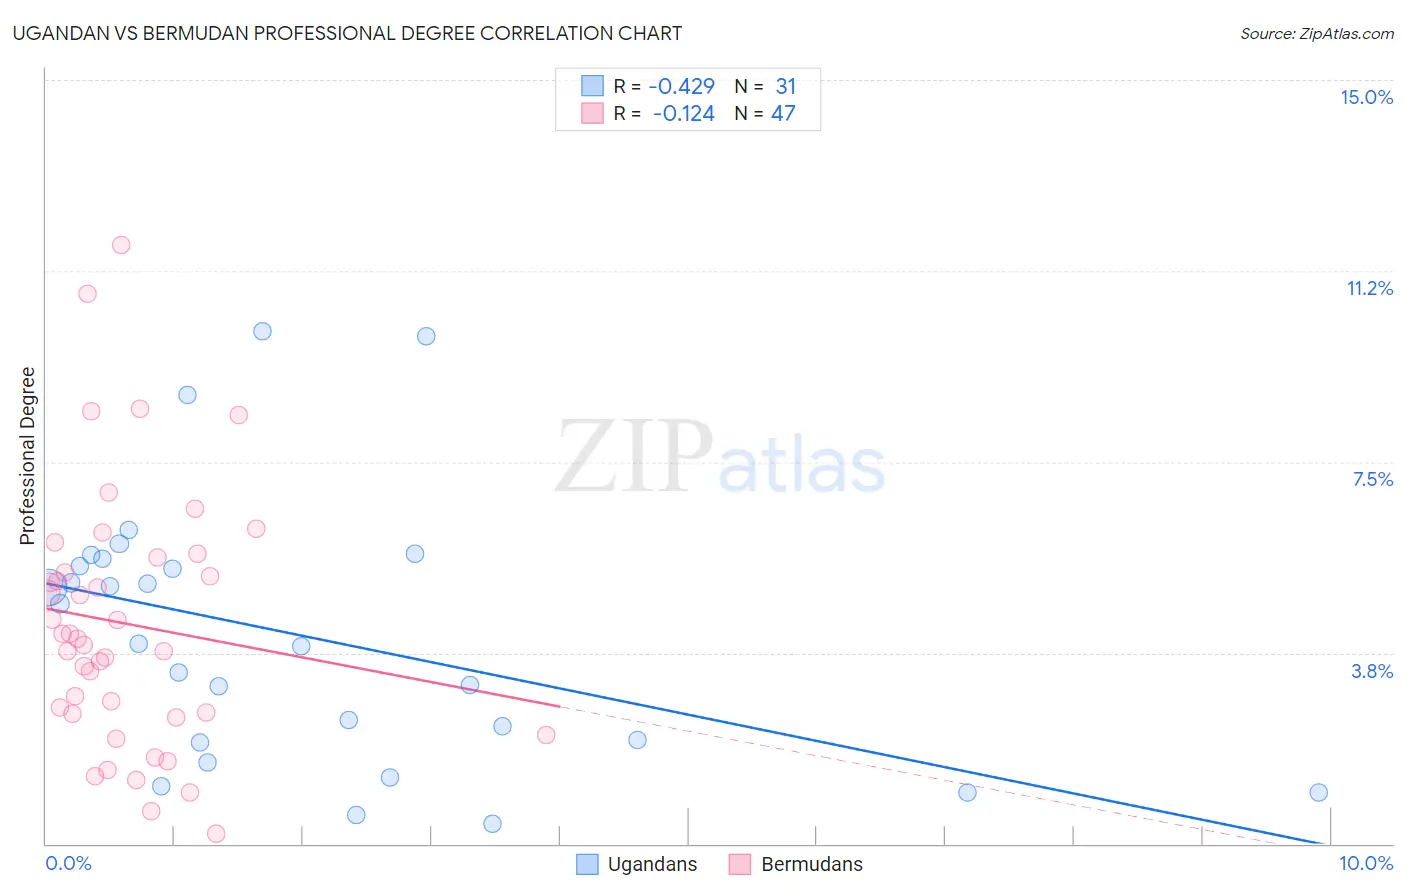
Ugandan vs Bermudan Professional Degree Correlation Chart
The statistical analysis conducted on geographies consisting of 93,981,800 people shows a moderate negative correlation between the proportion of Ugandans and percentage of population with at least professional degree education in the United States with a correlation coefficient (R) of -0.429 and weighted average of 5.1%. Similarly, the statistical analysis conducted on geographies consisting of 55,708,616 people shows a poor negative correlation between the proportion of Bermudans and percentage of population with at least professional degree education in the United States with a correlation coefficient (R) of -0.124 and weighted average of 4.4%, a difference of 17.3%.
Professional Degree Correlation Summary
| Measurement | Ugandan | Bermudan |
| Minimum | 0.38% | 0.19% |
| Maximum | 10.1% | 11.8% |
| Range | 9.7% | 11.6% |
| Mean | 4.1% | 4.3% |
| Median | 3.9% | 4.0% |
| Interquartile 25% (IQ1) | 2.0% | 2.5% |
| Interquartile 75% (IQ3) | 5.6% | 5.6% |
| Interquartile Range (IQR) | 3.6% | 3.1% |
| Standard Deviation (Sample) | 2.6% | 2.5% |
| Standard Deviation (Population) | 2.5% | 2.5% |
Similar Demographics by Professional Degree
Demographics Similar to Ugandans by Professional Degree
In terms of professional degree, the demographic groups most similar to Ugandans are Immigrants from Egypt (5.1%, a difference of 0.75%), Immigrants from Italy (5.2%, a difference of 0.76%), Austrian (5.2%, a difference of 0.82%), Ukrainian (5.1%, a difference of 0.83%), and Syrian (5.2%, a difference of 0.85%).
| Demographics | Rating | Rank | Professional Degree |
| Northern Europeans | 99.3 /100 | #93 | Exceptional 5.2% |
| Alsatians | 99.3 /100 | #94 | Exceptional 5.2% |
| Zimbabweans | 99.3 /100 | #95 | Exceptional 5.2% |
| Immigrants | Uzbekistan | 99.2 /100 | #96 | Exceptional 5.2% |
| Syrians | 99.1 /100 | #97 | Exceptional 5.2% |
| Austrians | 99.1 /100 | #98 | Exceptional 5.2% |
| Immigrants | Italy | 99.1 /100 | #99 | Exceptional 5.2% |
| Ugandans | 98.8 /100 | #100 | Exceptional 5.1% |
| Immigrants | Egypt | 98.5 /100 | #101 | Exceptional 5.1% |
| Ukrainians | 98.5 /100 | #102 | Exceptional 5.1% |
| Immigrants | Northern Africa | 98.4 /100 | #103 | Exceptional 5.1% |
| Arabs | 98.2 /100 | #104 | Exceptional 5.0% |
| Immigrants | Uganda | 98.2 /100 | #105 | Exceptional 5.0% |
| Immigrants | Ukraine | 98.2 /100 | #106 | Exceptional 5.0% |
| Maltese | 98.1 /100 | #107 | Exceptional 5.0% |
Demographics Similar to Bermudans by Professional Degree
In terms of professional degree, the demographic groups most similar to Bermudans are Immigrants (4.4%, a difference of 0.010%), Danish (4.4%, a difference of 0.060%), Czech (4.4%, a difference of 0.28%), Immigrants from Kenya (4.4%, a difference of 0.42%), and Immigrants from Costa Rica (4.4%, a difference of 0.53%).
| Demographics | Rating | Rank | Professional Degree |
| Immigrants | Peru | 49.3 /100 | #176 | Average 4.4% |
| Celtics | 47.6 /100 | #177 | Average 4.4% |
| Immigrants | Costa Rica | 46.7 /100 | #178 | Average 4.4% |
| Immigrants | Kenya | 45.9 /100 | #179 | Average 4.4% |
| Czechs | 44.9 /100 | #180 | Average 4.4% |
| Danes | 43.5 /100 | #181 | Average 4.4% |
| Immigrants | Immigrants | 43.2 /100 | #182 | Average 4.4% |
| Bermudans | 43.1 /100 | #183 | Average 4.4% |
| Belgians | 36.2 /100 | #184 | Fair 4.3% |
| Welsh | 35.8 /100 | #185 | Fair 4.3% |
| Scotch-Irish | 34.2 /100 | #186 | Fair 4.3% |
| Immigrants | Cameroon | 33.3 /100 | #187 | Fair 4.3% |
| Immigrants | Thailand | 31.7 /100 | #188 | Fair 4.3% |
| Slovaks | 30.7 /100 | #189 | Fair 4.3% |
| Immigrants | Poland | 29.2 /100 | #190 | Fair 4.3% |