Sioux vs Bermudan Householder Income Under 25 years

COMPARE

Sioux
Race
Ancestry
AfghanAfricanAlaska NativeAlaskan AthabascanAlbanianAleutAlsatianAmericanApacheArabArapahoArgentineanArmenianAssyrian/Chaldean/SyriacAustralianAustrianBahamianBangladeshiBarbadianBasqueBelgianBelizeanBhutaneseBlackfeetBolivianBrazilianBritishBritish West IndianBulgarianBurmeseCajunCambodianCanadianCape VerdeanCarpatho RusynCelticCentral AmericanCentral American IndianCherokeeCheyenneChickasawChileanChineseChippewaChoctawColombianColvilleComancheCosta RicanCreeCreekCroatianCrowCubanCypriotCzechCzechoslovakianDanishDelawareDominicanDutchDutch West IndianEastern EuropeanEcuadorianEgyptianEnglishEstonianEthiopianEuropeanFijianFilipinoFinnishFrenchFrench American IndianFrench CanadianGermanGerman RussianGhanaianGreekGuamanian/ChamorroGuatemalanGuyaneseHaitianHmongHonduranHopiHoumaHungarianIcelanderIndian (Asian)IndonesianInupiatIranianIraqiIrishIroquoisIsraeliItalianJamaicanJapaneseJordanianKenyanKiowaKoreanLaotianLatvianLebaneseLiberianLithuanianLumbeeLuxembourgerMacedonianMalaysianMalteseMarshalleseMenomineeMexicanMexican American IndianMongolianMoroccanNative HawaiianNavajoNepaleseNew ZealanderNicaraguanNigerianNorthern EuropeanNorwegianOkinawanOsageOttawaPaiutePakistaniPalestinianPanamanianParaguayanPennsylvania GermanPeruvianPimaPolishPortuguesePotawatomiPuebloPuerto RicanPuget Sound SalishRomanianRussianSalvadoranSamoanScandinavianScotch-IrishScottishSeminoleSenegaleseSerbianShoshoneSierra LeoneanSiouxSlavicSlovakSloveneSomaliSouth AfricanSouth AmericanSouth American IndianSoviet UnionSpaniardSpanishSpanish AmericanSpanish American IndianSri LankanSubsaharan AfricanSudaneseSwedishSwissSyrianTaiwaneseThaiTlingit-HaidaTohono O'OdhamTonganTrinidadian and TobagonianTsimshianTurkishU.S. Virgin IslanderUgandanUkrainianUruguayanUteVenezuelanVietnameseWelshWest IndianYakamaYaquiYugoslavianYumanYup'ikZimbabwean
Immigration
NonimmigrantsImmigrantsAfghanistanAfricaAlbaniaArgentinaArmeniaAsiaAustraliaAustriaBahamasBangladeshBarbadosBelarusBelgiumBelizeBoliviaBosnia and HerzegovinaBrazilBulgariaBurma/MyanmarCabo VerdeCambodiaCameroonCanadaCaribbeanCentral AmericaChileChinaColombiaCongoCosta RicaCroatiaCubaCzechoslovakiaDenmarkDominicaDominican RepublicEastern AfricaEastern AsiaEastern EuropeEcuadorEgyptEl SalvadorEnglandEritreaEthiopiaEuropeFijiFranceGermanyGhanaGreeceGrenadaGuatemalaGuyanaHaitiHondurasHong KongHungaryIndiaIndonesiaIranIraqIrelandIsraelItalyJamaicaJapanJordanKazakhstanKenyaKoreaKuwaitLaosLatin AmericaLatviaLebanonLiberiaLithuaniaMalaysiaMexicoMicronesiaMiddle AfricaMoldovaMoroccoNepalNetherlandsNicaraguaNigeriaNorth AmericaNorth MacedoniaNorthern AfricaNorthern EuropeNorwayOceaniaPakistanPanamaPeruPhilippinesPolandPortugalRomaniaRussiaSaudi ArabiaScotlandSenegalSerbiaSierra LeoneSingaporeSomaliaSouth AfricaSouth AmericaSouth Central AsiaSouth Eastern AsiaSouthern EuropeSpainSri LankaSt. Vincent and the GrenadinesSudanSwedenSwitzerlandSyriaTaiwanThailandTrinidad and TobagoTurkeyUgandaUkraineUruguayUzbekistanVenezuelaVietnamWest IndiesWestern AfricaWestern AsiaWestern EuropeYemenZaireZimbabweAzores
Bermudan
Race
Ancestry
AfghanAfricanAlaska NativeAlaskan AthabascanAlbanianAleutAlsatianAmericanApacheArabArapahoArgentineanArmenianAssyrian/Chaldean/SyriacAustralianAustrianBahamianBangladeshiBarbadianBasqueBelgianBelizeanBermudanBhutaneseBlackfeetBolivianBrazilianBritishBritish West IndianBulgarianBurmeseCajunCambodianCanadianCape VerdeanCarpatho RusynCelticCentral AmericanCentral American IndianCherokeeCheyenneChickasawChileanChineseChippewaChoctawColombianColvilleComancheCosta RicanCreeCreekCroatianCrowCubanCypriotCzechCzechoslovakianDanishDelawareDominicanDutchDutch West IndianEastern EuropeanEcuadorianEgyptianEnglishEstonianEthiopianEuropeanFijianFilipinoFinnishFrenchFrench American IndianFrench CanadianGermanGerman RussianGhanaianGreekGuamanian/ChamorroGuatemalanGuyaneseHaitianHmongHonduranHopiHoumaHungarianIcelanderIndian (Asian)IndonesianInupiatIranianIraqiIrishIroquoisIsraeliItalianJamaicanJapaneseJordanianKenyanKiowaKoreanLaotianLatvianLebaneseLiberianLithuanianLumbeeLuxembourgerMacedonianMalaysianMalteseMarshalleseMenomineeMexicanMexican American IndianMongolianMoroccanNative HawaiianNavajoNepaleseNew ZealanderNicaraguanNigerianNorthern EuropeanNorwegianOkinawanOsageOttawaPaiutePakistaniPalestinianPanamanianParaguayanPennsylvania GermanPeruvianPimaPolishPortuguesePotawatomiPuebloPuerto RicanPuget Sound SalishRomanianRussianSalvadoranSamoanScandinavianScotch-IrishScottishSeminoleSenegaleseSerbianShoshoneSierra LeoneanSlavicSlovakSloveneSomaliSouth AfricanSouth AmericanSouth American IndianSoviet UnionSpaniardSpanishSpanish AmericanSpanish American IndianSri LankanSubsaharan AfricanSudaneseSwedishSwissSyrianTaiwaneseThaiTlingit-HaidaTohono O'OdhamTonganTrinidadian and TobagonianTsimshianTurkishU.S. Virgin IslanderUgandanUkrainianUruguayanUteVenezuelanVietnameseWelshWest IndianYakamaYaquiYugoslavianYumanYup'ikZimbabwean
Immigration
NonimmigrantsImmigrantsAfghanistanAfricaAlbaniaArgentinaArmeniaAsiaAustraliaAustriaBahamasBangladeshBarbadosBelarusBelgiumBelizeBoliviaBosnia and HerzegovinaBrazilBulgariaBurma/MyanmarCabo VerdeCambodiaCameroonCanadaCaribbeanCentral AmericaChileChinaColombiaCongoCosta RicaCroatiaCubaCzechoslovakiaDenmarkDominicaDominican RepublicEastern AfricaEastern AsiaEastern EuropeEcuadorEgyptEl SalvadorEnglandEritreaEthiopiaEuropeFijiFranceGermanyGhanaGreeceGrenadaGuatemalaGuyanaHaitiHondurasHong KongHungaryIndiaIndonesiaIranIraqIrelandIsraelItalyJamaicaJapanJordanKazakhstanKenyaKoreaKuwaitLaosLatin AmericaLatviaLebanonLiberiaLithuaniaMalaysiaMexicoMicronesiaMiddle AfricaMoldovaMoroccoNepalNetherlandsNicaraguaNigeriaNorth AmericaNorth MacedoniaNorthern AfricaNorthern EuropeNorwayOceaniaPakistanPanamaPeruPhilippinesPolandPortugalRomaniaRussiaSaudi ArabiaScotlandSenegalSerbiaSierra LeoneSingaporeSomaliaSouth AfricaSouth AmericaSouth Central AsiaSouth Eastern AsiaSouthern EuropeSpainSri LankaSt. Vincent and the GrenadinesSudanSwedenSwitzerlandSyriaTaiwanThailandTrinidad and TobagoTurkeyUgandaUkraineUruguayUzbekistanVenezuelaVietnamWest IndiesWestern AfricaWestern AsiaWestern EuropeYemenZaireZimbabweAzores
Householder Income Under 25 years
Income
Poverty
Unemployment
Labor Participation
Family Structure
Vehicle Availability
Education Level
Disability

Householder Income Under 25 years Comparison

Sioux

Bermudans

Tragic
Tragic
$46,417
HOUSEHOLDER INCOME UNDER 25 YEARS
0.0/ 100
METRIC RATING
322nd/ 347
METRIC RANK
$47,359
HOUSEHOLDER INCOME UNDER 25 YEARS
0.0/ 100
METRIC RATING
312th/ 347
METRIC RANK

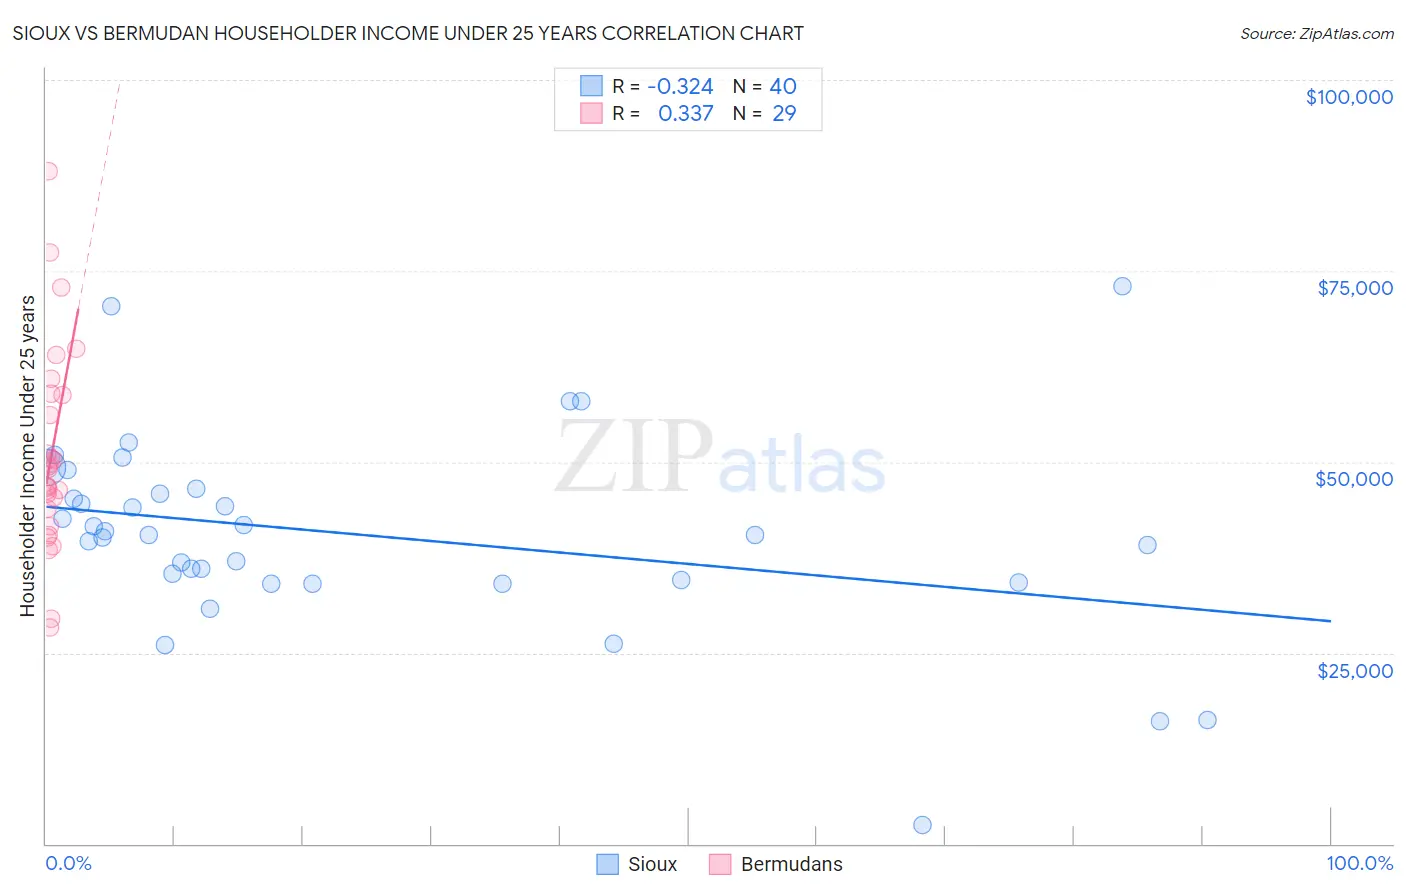
Sioux vs Bermudan Householder Income Under 25 years Correlation Chart

The statistical analysis conducted on geographies consisting of 212,065,769 people shows a mild negative correlation between the proportion of Sioux and household income with householder under the age of 25 in the United States with a correlation coefficient (R) of -0.324 and weighted average of $46,417. Similarly, the statistical analysis conducted on geographies consisting of 52,946,816 people shows a mild positive correlation between the proportion of Bermudans and household income with householder under the age of 25 in the United States with a correlation coefficient (R) of 0.337 and weighted average of $47,359, a difference of 2.0%.
Sioux vs Bermudan Householder Income Under 25 years

Householder Income Under 25 years Correlation Summary

MeasurementSiouxBermudan
Minimum$2,499$28,306
Maximum$72,963$87,995
Range$70,464$59,689
Mean$40,443$51,037
Median$40,443$49,161
Interquartile 25% (IQ1)$34,375$42,763
Interquartile 75% (IQ3)$46,105$58,788
Interquartile Range (IQR)$11,730$16,024
Standard Deviation (Sample)$13,035$13,290
Standard Deviation (Population)$12,871$13,059

Demographics Similar to Sioux and Bermudans by Householder Income Under 25 years

In terms of householder income under 25 years, the demographic groups most similar to Sioux are Potawatomi ($46,462, a difference of 0.10%), Immigrants from Saudi Arabia ($46,187, a difference of 0.50%), Immigrants from Sudan ($46,791, a difference of 0.81%), African ($46,838, a difference of 0.91%), and Spanish American ($46,913, a difference of 1.1%). Similarly, the demographic groups most similar to Bermudans are Ottawa ($47,366, a difference of 0.010%), Iroquois ($47,380, a difference of 0.040%), U.S. Virgin Islander ($47,448, a difference of 0.19%), Comanche ($47,518, a difference of 0.34%), and Delaware ($47,159, a difference of 0.43%).
DemographicsRating | RankHouseholder Income Under 25 years
Bangladeshis
0.0
/100
|
#307
Tragic
$47,589
Comanche
0.0
/100
|
#308
Tragic
$47,518
U.S. Virgin Islanders
0.0
/100
|
#309
Tragic
$47,448
Iroquois
0.0
/100
|
#310
Tragic
$47,380
Ottawa
0.0
/100
|
#311
Tragic
$47,366
Bermudans
0.0
/100
|
#312
Tragic
$47,359
Delaware
0.0
/100
|
#313
Tragic
$47,159
Chippewa
0.0
/100
|
#314
Tragic
$47,015
Crow
0.0
/100
|
#315
Tragic
$47,012
Sudanese
0.0
/100
|
#316
Tragic
$46,982
Hopi
0.0
/100
|
#317
Tragic
$46,978
Spanish Americans
0.0
/100
|
#318
Tragic
$46,913
Africans
0.0
/100
|
#319
Tragic
$46,838
Immigrants | Sudan
0.0
/100
|
#320
Tragic
$46,791
Potawatomi
0.0
/100
|
#321
Tragic
$46,462
Sioux
0.0
/100
|
#322
Tragic
$46,417
Immigrants | Saudi Arabia
0.0
/100
|
#323
Tragic
$46,187
Dutch West Indians
0.0
/100
|
#324
Tragic
$45,816
Immigrants | Bahamas
0.0
/100
|
#325
Tragic
$45,793
Osage
0.0
/100
|
#326
Tragic
$45,764
Bahamians
0.0
/100
|
#327
Tragic
$45,743