Pueblo vs Bermudan Professional Degree
COMPARE
Pueblo
Bermudan
Professional Degree
Professional Degree Comparison
Pueblo
Bermudans
3.7%
PROFESSIONAL DEGREE
1.4/ 100
METRIC RATING
253rd/ 347
METRIC RANK
4.4%
PROFESSIONAL DEGREE
43.1/ 100
METRIC RATING
183rd/ 347
METRIC RANK
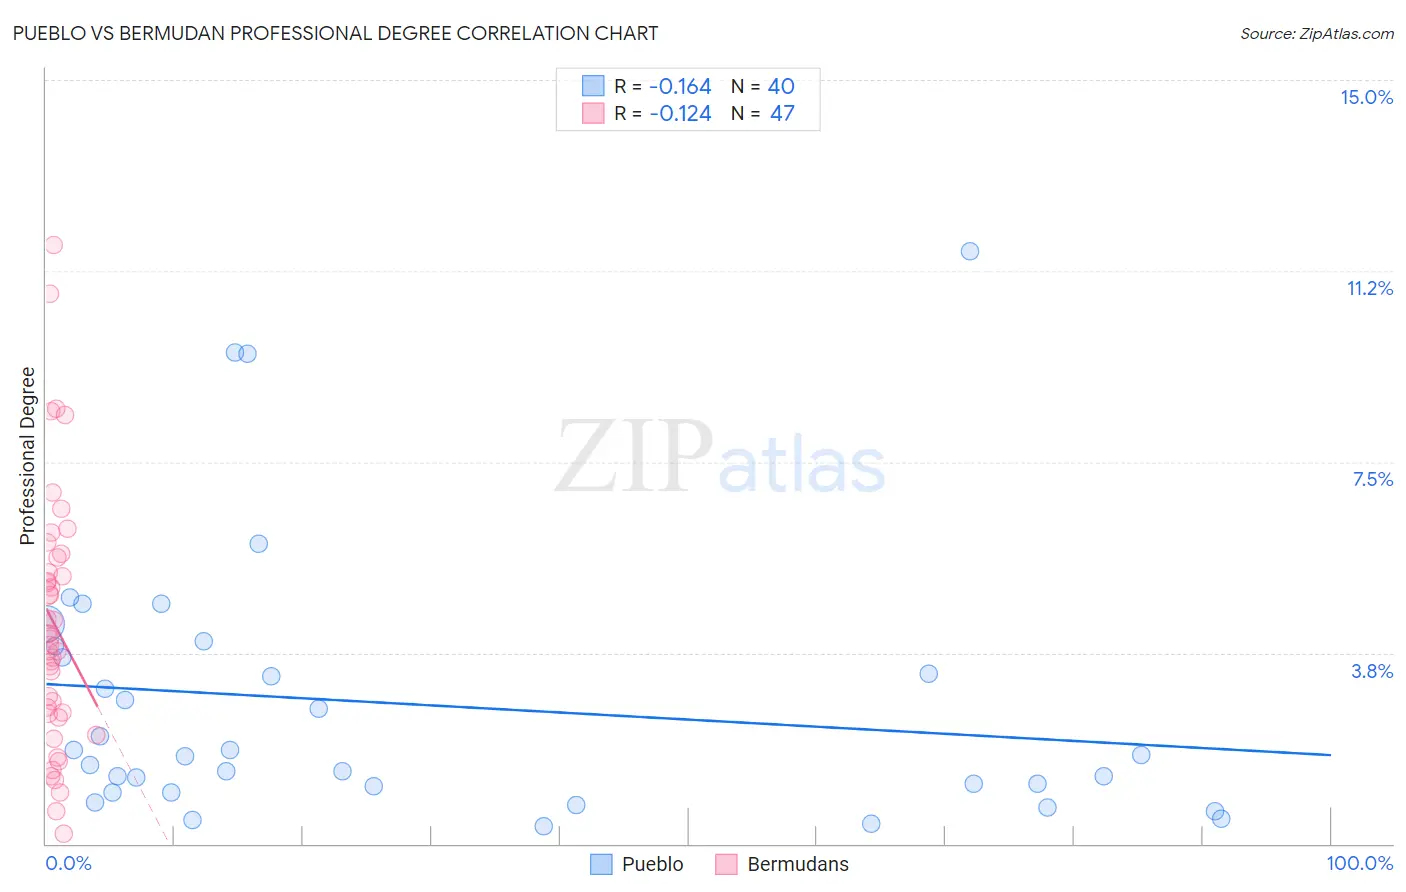
Pueblo vs Bermudan Professional Degree Correlation Chart
The statistical analysis conducted on geographies consisting of 119,857,824 people shows a poor negative correlation between the proportion of Pueblo and percentage of population with at least professional degree education in the United States with a correlation coefficient (R) of -0.164 and weighted average of 3.7%. Similarly, the statistical analysis conducted on geographies consisting of 55,708,616 people shows a poor negative correlation between the proportion of Bermudans and percentage of population with at least professional degree education in the United States with a correlation coefficient (R) of -0.124 and weighted average of 4.4%, a difference of 17.2%.
Professional Degree Correlation Summary
| Measurement | Pueblo | Bermudan |
| Minimum | 0.33% | 0.19% |
| Maximum | 11.6% | 11.8% |
| Range | 11.3% | 11.6% |
| Mean | 2.7% | 4.3% |
| Median | 1.7% | 4.0% |
| Interquartile 25% (IQ1) | 1.1% | 2.5% |
| Interquartile 75% (IQ3) | 3.8% | 5.6% |
| Interquartile Range (IQR) | 2.7% | 3.1% |
| Standard Deviation (Sample) | 2.6% | 2.5% |
| Standard Deviation (Population) | 2.6% | 2.5% |
Similar Demographics by Professional Degree
Demographics Similar to Pueblo by Professional Degree
In terms of professional degree, the demographic groups most similar to Pueblo are Jamaican (3.7%, a difference of 0.10%), Tongan (3.7%, a difference of 0.14%), Immigrants from Nicaragua (3.7%, a difference of 0.24%), Immigrants from Fiji (3.7%, a difference of 0.50%), and Immigrants from Grenada (3.7%, a difference of 0.56%).
| Demographics | Rating | Rank | Professional Degree |
| Marshallese | 1.7 /100 | #246 | Tragic 3.8% |
| Guyanese | 1.6 /100 | #247 | Tragic 3.8% |
| Hmong | 1.6 /100 | #248 | Tragic 3.7% |
| Immigrants | Grenada | 1.5 /100 | #249 | Tragic 3.7% |
| Immigrants | Fiji | 1.5 /100 | #250 | Tragic 3.7% |
| Immigrants | Nicaragua | 1.4 /100 | #251 | Tragic 3.7% |
| Jamaicans | 1.4 /100 | #252 | Tragic 3.7% |
| Pueblo | 1.4 /100 | #253 | Tragic 3.7% |
| Tongans | 1.3 /100 | #254 | Tragic 3.7% |
| Osage | 1.2 /100 | #255 | Tragic 3.7% |
| Iroquois | 1.2 /100 | #256 | Tragic 3.7% |
| Bahamians | 1.1 /100 | #257 | Tragic 3.7% |
| Immigrants | St. Vincent and the Grenadines | 1.1 /100 | #258 | Tragic 3.7% |
| Africans | 1.0 /100 | #259 | Tragic 3.7% |
| Indonesians | 1.0 /100 | #260 | Tragic 3.7% |
Demographics Similar to Bermudans by Professional Degree
In terms of professional degree, the demographic groups most similar to Bermudans are Immigrants (4.4%, a difference of 0.010%), Danish (4.4%, a difference of 0.060%), Czech (4.4%, a difference of 0.28%), Immigrants from Kenya (4.4%, a difference of 0.42%), and Immigrants from Costa Rica (4.4%, a difference of 0.53%).
| Demographics | Rating | Rank | Professional Degree |
| Immigrants | Peru | 49.3 /100 | #176 | Average 4.4% |
| Celtics | 47.6 /100 | #177 | Average 4.4% |
| Immigrants | Costa Rica | 46.7 /100 | #178 | Average 4.4% |
| Immigrants | Kenya | 45.9 /100 | #179 | Average 4.4% |
| Czechs | 44.9 /100 | #180 | Average 4.4% |
| Danes | 43.5 /100 | #181 | Average 4.4% |
| Immigrants | Immigrants | 43.2 /100 | #182 | Average 4.4% |
| Bermudans | 43.1 /100 | #183 | Average 4.4% |
| Belgians | 36.2 /100 | #184 | Fair 4.3% |
| Welsh | 35.8 /100 | #185 | Fair 4.3% |
| Scotch-Irish | 34.2 /100 | #186 | Fair 4.3% |
| Immigrants | Cameroon | 33.3 /100 | #187 | Fair 4.3% |
| Immigrants | Thailand | 31.7 /100 | #188 | Fair 4.3% |
| Slovaks | 30.7 /100 | #189 | Fair 4.3% |
| Immigrants | Poland | 29.2 /100 | #190 | Fair 4.3% |