Moroccan vs Bermudan Professional Degree
COMPARE
Moroccan
Bermudan
Professional Degree
Professional Degree Comparison
Moroccans
Bermudans
5.0%
PROFESSIONAL DEGREE
96.8/ 100
METRIC RATING
115th/ 347
METRIC RANK
4.4%
PROFESSIONAL DEGREE
43.1/ 100
METRIC RATING
183rd/ 347
METRIC RANK
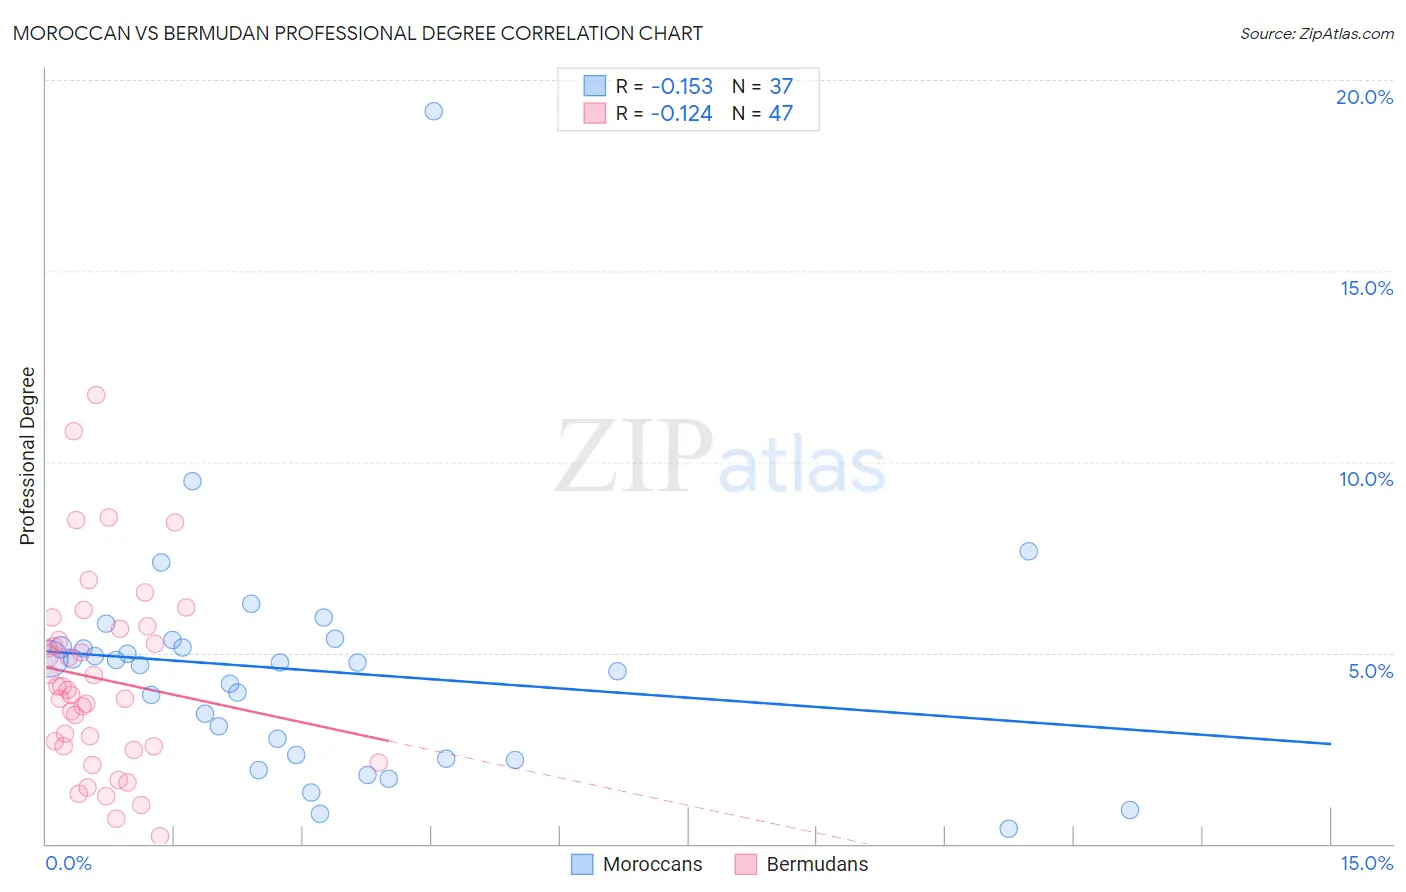
Moroccan vs Bermudan Professional Degree Correlation Chart
The statistical analysis conducted on geographies consisting of 201,703,459 people shows a poor negative correlation between the proportion of Moroccans and percentage of population with at least professional degree education in the United States with a correlation coefficient (R) of -0.153 and weighted average of 5.0%. Similarly, the statistical analysis conducted on geographies consisting of 55,708,616 people shows a poor negative correlation between the proportion of Bermudans and percentage of population with at least professional degree education in the United States with a correlation coefficient (R) of -0.124 and weighted average of 4.4%, a difference of 13.5%.
Professional Degree Correlation Summary
| Measurement | Moroccan | Bermudan |
| Minimum | 0.40% | 0.19% |
| Maximum | 19.2% | 11.8% |
| Range | 18.8% | 11.6% |
| Mean | 4.5% | 4.3% |
| Median | 4.7% | 4.0% |
| Interquartile 25% (IQ1) | 2.3% | 2.5% |
| Interquartile 75% (IQ3) | 5.2% | 5.6% |
| Interquartile Range (IQR) | 3.0% | 3.1% |
| Standard Deviation (Sample) | 3.2% | 2.5% |
| Standard Deviation (Population) | 3.1% | 2.5% |
Similar Demographics by Professional Degree
Demographics Similar to Moroccans by Professional Degree
In terms of professional degree, the demographic groups most similar to Moroccans are Immigrants from Morocco (5.0%, a difference of 0.10%), Venezuelan (4.9%, a difference of 0.47%), Immigrants from Pakistan (5.0%, a difference of 0.55%), Taiwanese (5.0%, a difference of 0.57%), and Immigrants from Syria (4.9%, a difference of 0.68%).
| Demographics | Rating | Rank | Professional Degree |
| Immigrants | Southern Europe | 98.1 /100 | #108 | Exceptional 5.0% |
| British | 98.0 /100 | #109 | Exceptional 5.0% |
| Lebanese | 98.0 /100 | #110 | Exceptional 5.0% |
| Brazilians | 97.4 /100 | #111 | Exceptional 5.0% |
| Taiwanese | 97.3 /100 | #112 | Exceptional 5.0% |
| Immigrants | Pakistan | 97.2 /100 | #113 | Exceptional 5.0% |
| Immigrants | Morocco | 96.8 /100 | #114 | Exceptional 5.0% |
| Moroccans | 96.8 /100 | #115 | Exceptional 5.0% |
| Venezuelans | 96.3 /100 | #116 | Exceptional 4.9% |
| Immigrants | Syria | 96.0 /100 | #117 | Exceptional 4.9% |
| Croatians | 96.0 /100 | #118 | Exceptional 4.9% |
| Immigrants | Sudan | 95.4 /100 | #119 | Exceptional 4.9% |
| Albanians | 95.3 /100 | #120 | Exceptional 4.9% |
| Immigrants | Moldova | 94.8 /100 | #121 | Exceptional 4.9% |
| Immigrants | Germany | 94.1 /100 | #122 | Exceptional 4.9% |
Demographics Similar to Bermudans by Professional Degree
In terms of professional degree, the demographic groups most similar to Bermudans are Immigrants (4.4%, a difference of 0.010%), Danish (4.4%, a difference of 0.060%), Czech (4.4%, a difference of 0.28%), Immigrants from Kenya (4.4%, a difference of 0.42%), and Immigrants from Costa Rica (4.4%, a difference of 0.53%).
| Demographics | Rating | Rank | Professional Degree |
| Immigrants | Peru | 49.3 /100 | #176 | Average 4.4% |
| Celtics | 47.6 /100 | #177 | Average 4.4% |
| Immigrants | Costa Rica | 46.7 /100 | #178 | Average 4.4% |
| Immigrants | Kenya | 45.9 /100 | #179 | Average 4.4% |
| Czechs | 44.9 /100 | #180 | Average 4.4% |
| Danes | 43.5 /100 | #181 | Average 4.4% |
| Immigrants | Immigrants | 43.2 /100 | #182 | Average 4.4% |
| Bermudans | 43.1 /100 | #183 | Average 4.4% |
| Belgians | 36.2 /100 | #184 | Fair 4.3% |
| Welsh | 35.8 /100 | #185 | Fair 4.3% |
| Scotch-Irish | 34.2 /100 | #186 | Fair 4.3% |
| Immigrants | Cameroon | 33.3 /100 | #187 | Fair 4.3% |
| Immigrants | Thailand | 31.7 /100 | #188 | Fair 4.3% |
| Slovaks | 30.7 /100 | #189 | Fair 4.3% |
| Immigrants | Poland | 29.2 /100 | #190 | Fair 4.3% |