Canadian vs Australian GED/Equivalency
COMPARE
Canadian
Australian
GED/Equivalency
GED/Equivalency Comparison
Canadians
Australians
87.1%
GED/EQUIVALENCY
95.6/ 100
METRIC RATING
108th/ 347
METRIC RANK
88.1%
GED/EQUIVALENCY
99.5/ 100
METRIC RATING
49th/ 347
METRIC RANK
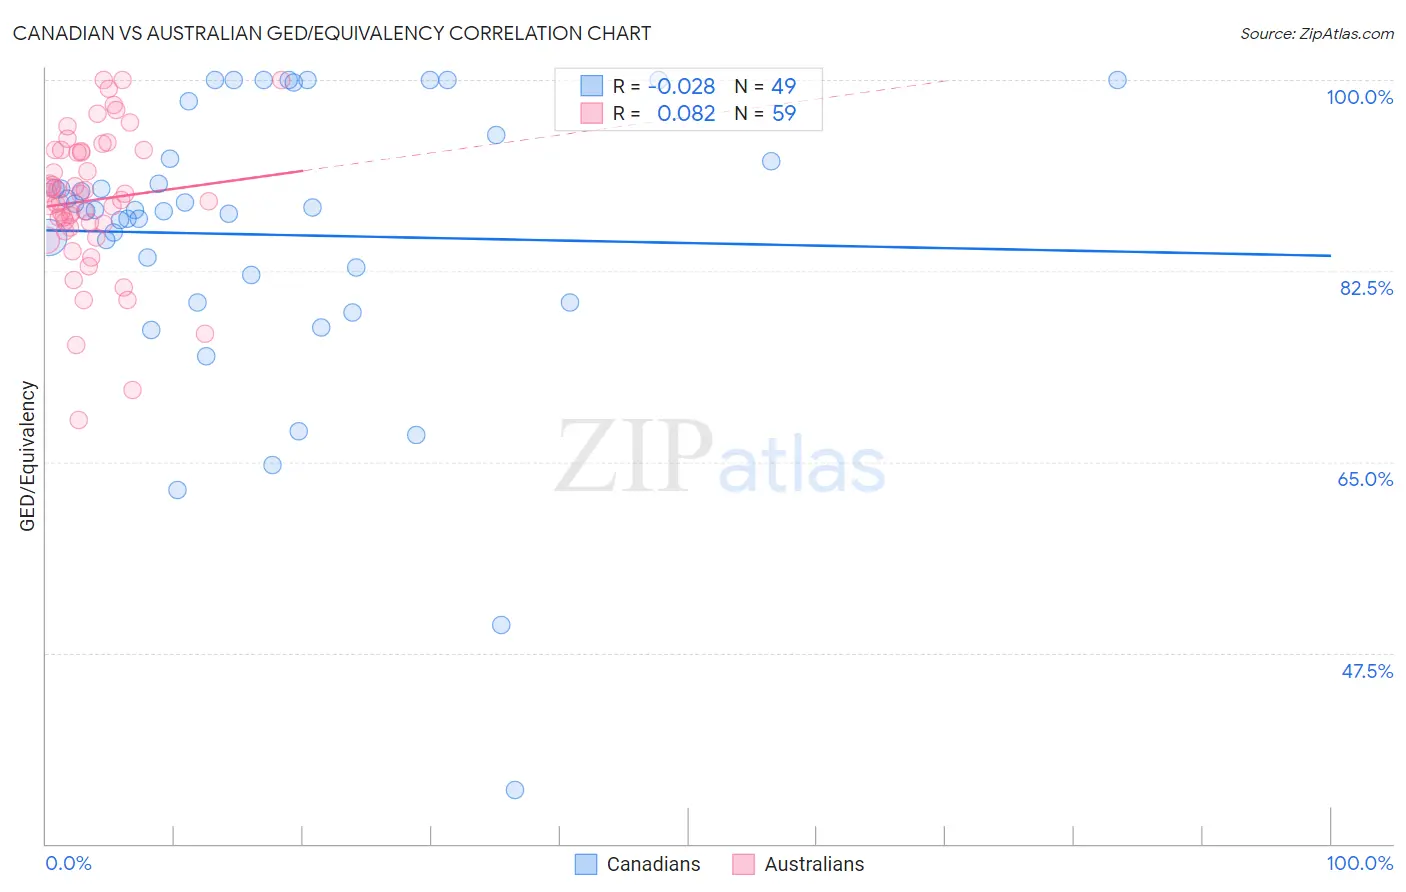
Canadian vs Australian GED/Equivalency Correlation Chart
The statistical analysis conducted on geographies consisting of 437,556,595 people shows no correlation between the proportion of Canadians and percentage of population with at least ged/equivalency education in the United States with a correlation coefficient (R) of -0.028 and weighted average of 87.1%. Similarly, the statistical analysis conducted on geographies consisting of 224,163,773 people shows a slight positive correlation between the proportion of Australians and percentage of population with at least ged/equivalency education in the United States with a correlation coefficient (R) of 0.082 and weighted average of 88.1%, a difference of 1.1%.
GED/Equivalency Correlation Summary
| Measurement | Canadian | Australian |
| Minimum | 34.9% | 68.9% |
| Maximum | 100.0% | 100.0% |
| Range | 65.1% | 31.1% |
| Mean | 85.8% | 89.0% |
| Median | 88.1% | 89.0% |
| Interquartile 25% (IQ1) | 80.9% | 86.5% |
| Interquartile 75% (IQ3) | 93.9% | 93.6% |
| Interquartile Range (IQR) | 13.0% | 7.0% |
| Standard Deviation (Sample) | 13.3% | 6.5% |
| Standard Deviation (Population) | 13.1% | 6.5% |
Similar Demographics by GED/Equivalency
Demographics Similar to Canadians by GED/Equivalency
In terms of ged/equivalency, the demographic groups most similar to Canadians are Immigrants from Eastern Europe (87.1%, a difference of 0.010%), Icelander (87.1%, a difference of 0.020%), Immigrants from Zimbabwe (87.1%, a difference of 0.030%), Indian (Asian) (87.1%, a difference of 0.040%), and Egyptian (87.1%, a difference of 0.040%).
| Demographics | Rating | Rank | GED/Equivalency |
| Syrians | 96.6 /100 | #101 | Exceptional 87.2% |
| Lebanese | 96.2 /100 | #102 | Exceptional 87.2% |
| Jordanians | 96.1 /100 | #103 | Exceptional 87.2% |
| Immigrants | Hungary | 96.0 /100 | #104 | Exceptional 87.2% |
| Indians (Asian) | 95.9 /100 | #105 | Exceptional 87.1% |
| Immigrants | Zimbabwe | 95.8 /100 | #106 | Exceptional 87.1% |
| Icelanders | 95.7 /100 | #107 | Exceptional 87.1% |
| Canadians | 95.6 /100 | #108 | Exceptional 87.1% |
| Immigrants | Eastern Europe | 95.5 /100 | #109 | Exceptional 87.1% |
| Egyptians | 95.3 /100 | #110 | Exceptional 87.1% |
| French | 95.2 /100 | #111 | Exceptional 87.1% |
| Tlingit-Haida | 94.8 /100 | #112 | Exceptional 87.0% |
| Assyrians/Chaldeans/Syriacs | 94.8 /100 | #113 | Exceptional 87.0% |
| Immigrants | Kazakhstan | 94.7 /100 | #114 | Exceptional 87.0% |
| Mongolians | 94.6 /100 | #115 | Exceptional 87.0% |
Demographics Similar to Australians by GED/Equivalency
In terms of ged/equivalency, the demographic groups most similar to Australians are Greek (88.1%, a difference of 0.010%), Immigrants from Korea (88.1%, a difference of 0.010%), Immigrants from Latvia (88.1%, a difference of 0.020%), Immigrants from Switzerland (88.1%, a difference of 0.030%), and Czech (88.1%, a difference of 0.040%).
| Demographics | Rating | Rank | GED/Equivalency |
| Cambodians | 99.6 /100 | #42 | Exceptional 88.2% |
| Immigrants | Scotland | 99.6 /100 | #43 | Exceptional 88.2% |
| Macedonians | 99.5 /100 | #44 | Exceptional 88.1% |
| Czechs | 99.5 /100 | #45 | Exceptional 88.1% |
| Immigrants | Switzerland | 99.5 /100 | #46 | Exceptional 88.1% |
| Immigrants | Latvia | 99.5 /100 | #47 | Exceptional 88.1% |
| Greeks | 99.5 /100 | #48 | Exceptional 88.1% |
| Australians | 99.5 /100 | #49 | Exceptional 88.1% |
| Immigrants | Korea | 99.5 /100 | #50 | Exceptional 88.1% |
| Immigrants | Netherlands | 99.4 /100 | #51 | Exceptional 88.0% |
| Zimbabweans | 99.4 /100 | #52 | Exceptional 88.0% |
| Immigrants | South Africa | 99.4 /100 | #53 | Exceptional 88.0% |
| Soviet Union | 99.4 /100 | #54 | Exceptional 88.0% |
| New Zealanders | 99.4 /100 | #55 | Exceptional 88.0% |
| Immigrants | Denmark | 99.4 /100 | #56 | Exceptional 88.0% |