Sioux vs Alsatian High School Diploma
COMPARE
Sioux
Alsatian
High School Diploma
High School Diploma Comparison
Sioux
Alsatians
87.9%
HIGH SCHOOL DIPLOMA
2.7/ 100
METRIC RATING
238th/ 347
METRIC RANK
89.4%
HIGH SCHOOL DIPLOMA
66.8/ 100
METRIC RATING
154th/ 347
METRIC RANK
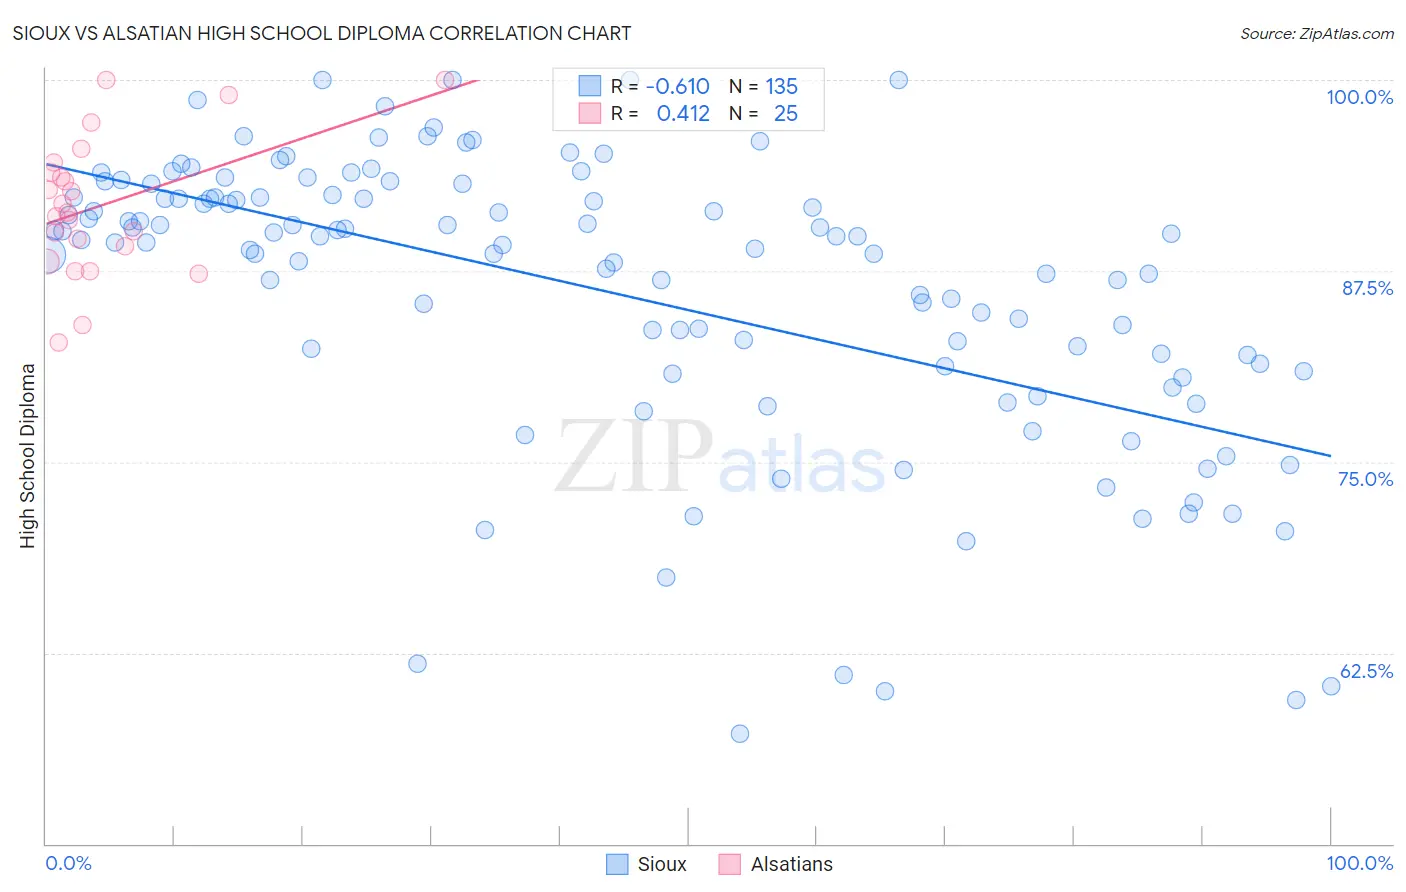
Sioux vs Alsatian High School Diploma Correlation Chart
The statistical analysis conducted on geographies consisting of 234,200,396 people shows a significant negative correlation between the proportion of Sioux and percentage of population with at least high school diploma education in the United States with a correlation coefficient (R) of -0.610 and weighted average of 87.9%. Similarly, the statistical analysis conducted on geographies consisting of 82,682,365 people shows a moderate positive correlation between the proportion of Alsatians and percentage of population with at least high school diploma education in the United States with a correlation coefficient (R) of 0.412 and weighted average of 89.4%, a difference of 1.6%.
High School Diploma Correlation Summary
| Measurement | Sioux | Alsatian |
| Minimum | 57.2% | 82.8% |
| Maximum | 100.0% | 100.0% |
| Range | 42.8% | 17.2% |
| Mean | 86.2% | 91.8% |
| Median | 89.4% | 91.3% |
| Interquartile 25% (IQ1) | 81.3% | 88.6% |
| Interquartile 75% (IQ3) | 92.3% | 94.3% |
| Interquartile Range (IQR) | 11.0% | 5.7% |
| Standard Deviation (Sample) | 9.4% | 4.5% |
| Standard Deviation (Population) | 9.4% | 4.4% |
Similar Demographics by High School Diploma
Demographics Similar to Sioux by High School Diploma
In terms of high school diploma, the demographic groups most similar to Sioux are Taiwanese (87.9%, a difference of 0.0%), South American (87.9%, a difference of 0.0%), Subsaharan African (87.9%, a difference of 0.010%), Immigrants from Bahamas (88.0%, a difference of 0.030%), and Immigrants from Panama (88.0%, a difference of 0.050%).
| Demographics | Rating | Rank | High School Diploma |
| Colombians | 3.8 /100 | #231 | Tragic 88.1% |
| Immigrants | Middle Africa | 3.4 /100 | #232 | Tragic 88.0% |
| Immigrants | Panama | 3.1 /100 | #233 | Tragic 88.0% |
| Immigrants | Thailand | 3.1 /100 | #234 | Tragic 88.0% |
| Immigrants | Bahamas | 2.9 /100 | #235 | Tragic 88.0% |
| Sub-Saharan Africans | 2.8 /100 | #236 | Tragic 87.9% |
| Taiwanese | 2.8 /100 | #237 | Tragic 87.9% |
| Sioux | 2.7 /100 | #238 | Tragic 87.9% |
| South Americans | 2.7 /100 | #239 | Tragic 87.9% |
| Comanche | 2.2 /100 | #240 | Tragic 87.9% |
| Immigrants | Uzbekistan | 2.1 /100 | #241 | Tragic 87.8% |
| Cheyenne | 2.1 /100 | #242 | Tragic 87.8% |
| Immigrants | Philippines | 1.9 /100 | #243 | Tragic 87.8% |
| Choctaw | 1.9 /100 | #244 | Tragic 87.8% |
| Peruvians | 1.9 /100 | #245 | Tragic 87.8% |
Demographics Similar to Alsatians by High School Diploma
In terms of high school diploma, the demographic groups most similar to Alsatians are Immigrants from Northern Africa (89.4%, a difference of 0.010%), Immigrants from Argentina (89.4%, a difference of 0.020%), Immigrants from Iraq (89.4%, a difference of 0.030%), Immigrants from Malaysia (89.3%, a difference of 0.050%), and Asian (89.4%, a difference of 0.070%).
| Demographics | Rating | Rank | High School Diploma |
| Iraqis | 73.9 /100 | #147 | Good 89.5% |
| Immigrants | Lebanon | 73.4 /100 | #148 | Good 89.5% |
| Immigrants | Poland | 72.9 /100 | #149 | Good 89.5% |
| Argentineans | 72.3 /100 | #150 | Good 89.5% |
| Paraguayans | 71.4 /100 | #151 | Good 89.5% |
| Asians | 70.7 /100 | #152 | Good 89.4% |
| Immigrants | Iraq | 68.7 /100 | #153 | Good 89.4% |
| Alsatians | 66.8 /100 | #154 | Good 89.4% |
| Immigrants | Northern Africa | 66.4 /100 | #155 | Good 89.4% |
| Immigrants | Argentina | 65.5 /100 | #156 | Good 89.4% |
| Immigrants | Malaysia | 63.5 /100 | #157 | Good 89.3% |
| Immigrants | Pakistan | 62.5 /100 | #158 | Good 89.3% |
| Immigrants | China | 62.0 /100 | #159 | Good 89.3% |
| Laotians | 61.8 /100 | #160 | Good 89.3% |
| Brazilians | 61.2 /100 | #161 | Good 89.3% |