Sierra Leonean vs Carpatho Rusyn Associate's Degree
COMPARE
Sierra Leonean
Carpatho Rusyn
Associate's Degree
Associate's Degree Comparison
Sierra Leoneans
Carpatho Rusyns
47.7%
ASSOCIATE'S DEGREE
82.9/ 100
METRIC RATING
142nd/ 347
METRIC RANK
50.6%
ASSOCIATE'S DEGREE
99.3/ 100
METRIC RATING
73rd/ 347
METRIC RANK
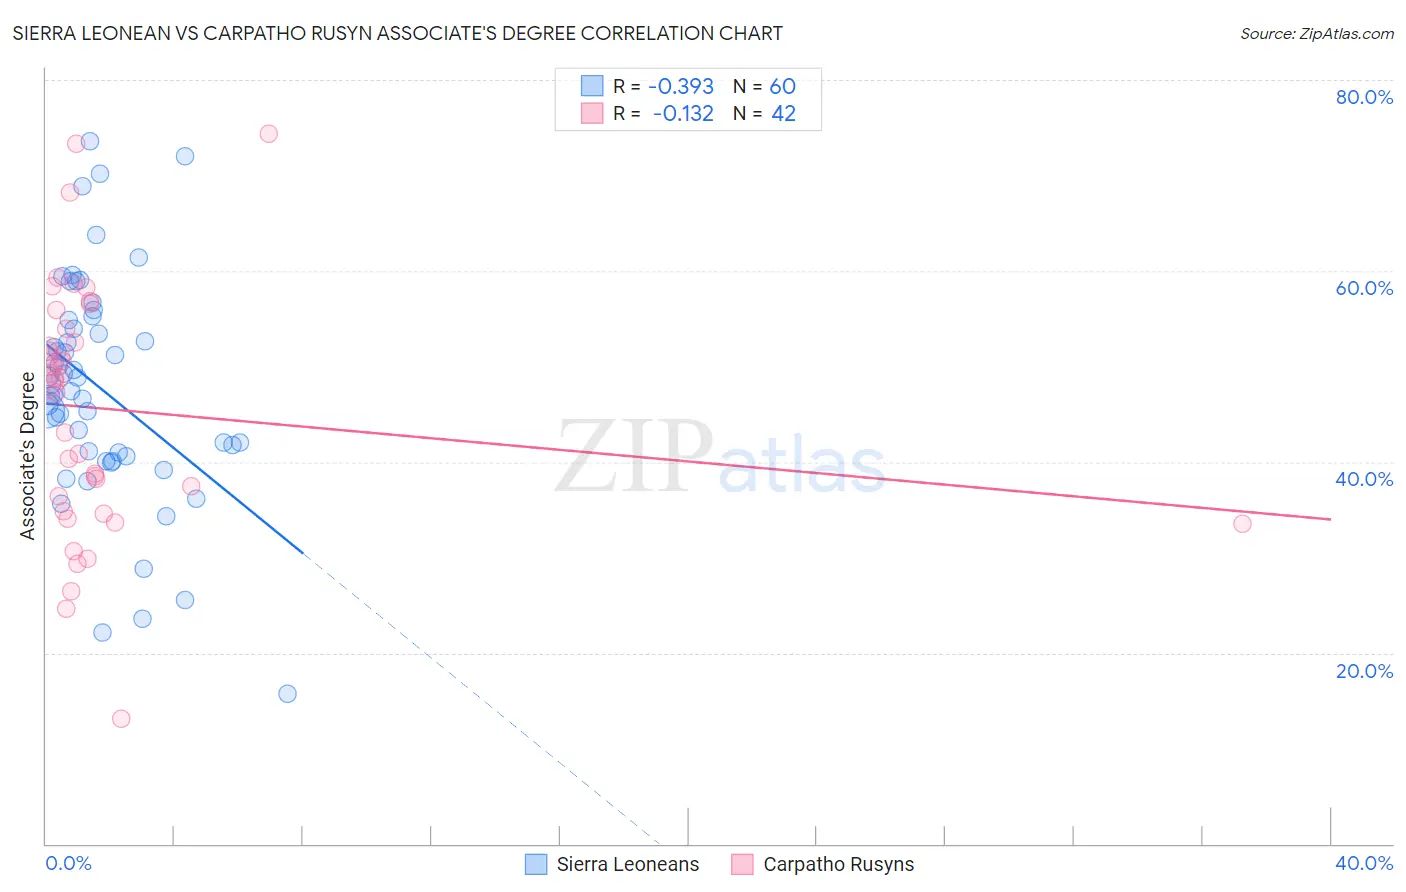
Sierra Leonean vs Carpatho Rusyn Associate's Degree Correlation Chart
The statistical analysis conducted on geographies consisting of 83,364,635 people shows a mild negative correlation between the proportion of Sierra Leoneans and percentage of population with at least associate's degree education in the United States with a correlation coefficient (R) of -0.393 and weighted average of 47.7%. Similarly, the statistical analysis conducted on geographies consisting of 58,871,690 people shows a poor negative correlation between the proportion of Carpatho Rusyns and percentage of population with at least associate's degree education in the United States with a correlation coefficient (R) of -0.132 and weighted average of 50.6%, a difference of 6.1%.
Associate's Degree Correlation Summary
| Measurement | Sierra Leonean | Carpatho Rusyn |
| Minimum | 15.7% | 13.2% |
| Maximum | 73.5% | 74.4% |
| Range | 57.8% | 61.2% |
| Mean | 47.6% | 45.6% |
| Median | 47.8% | 48.5% |
| Interquartile 25% (IQ1) | 40.7% | 34.9% |
| Interquartile 75% (IQ3) | 54.4% | 53.9% |
| Interquartile Range (IQR) | 13.6% | 19.0% |
| Standard Deviation (Sample) | 11.7% | 13.2% |
| Standard Deviation (Population) | 11.6% | 13.0% |
Similar Demographics by Associate's Degree
Demographics Similar to Sierra Leoneans by Associate's Degree
In terms of associate's degree, the demographic groups most similar to Sierra Leoneans are Taiwanese (47.7%, a difference of 0.050%), Immigrants from Southern Europe (47.8%, a difference of 0.20%), Norwegian (47.6%, a difference of 0.23%), Slavic (47.6%, a difference of 0.29%), and Slovene (47.9%, a difference of 0.30%).
| Demographics | Rating | Rank | Associate's Degree |
| Europeans | 89.0 /100 | #135 | Excellent 48.2% |
| Pakistanis | 88.0 /100 | #136 | Excellent 48.1% |
| Immigrants | Eritrea | 87.8 /100 | #137 | Excellent 48.1% |
| Poles | 87.3 /100 | #138 | Excellent 48.0% |
| Slovenes | 85.1 /100 | #139 | Excellent 47.9% |
| Immigrants | Southern Europe | 84.4 /100 | #140 | Excellent 47.8% |
| Taiwanese | 83.3 /100 | #141 | Excellent 47.7% |
| Sierra Leoneans | 82.9 /100 | #142 | Excellent 47.7% |
| Norwegians | 81.0 /100 | #143 | Excellent 47.6% |
| Slavs | 80.5 /100 | #144 | Excellent 47.6% |
| Canadians | 79.0 /100 | #145 | Good 47.5% |
| Immigrants | Sudan | 77.9 /100 | #146 | Good 47.4% |
| Danes | 77.3 /100 | #147 | Good 47.4% |
| South American Indians | 76.7 /100 | #148 | Good 47.4% |
| Immigrants | Armenia | 76.6 /100 | #149 | Good 47.4% |
Demographics Similar to Carpatho Rusyns by Associate's Degree
In terms of associate's degree, the demographic groups most similar to Carpatho Rusyns are Lithuanian (50.6%, a difference of 0.060%), Immigrants from Scotland (50.6%, a difference of 0.10%), Immigrants from Zimbabwe (50.5%, a difference of 0.31%), Immigrants from Lebanon (50.5%, a difference of 0.34%), and Immigrants from Eastern Europe (50.5%, a difference of 0.38%).
| Demographics | Rating | Rank | Associate's Degree |
| Immigrants | Europe | 99.7 /100 | #66 | Exceptional 51.3% |
| Argentineans | 99.6 /100 | #67 | Exceptional 51.2% |
| Immigrants | Indonesia | 99.5 /100 | #68 | Exceptional 51.0% |
| Egyptians | 99.5 /100 | #69 | Exceptional 50.9% |
| Immigrants | Argentina | 99.5 /100 | #70 | Exceptional 50.9% |
| Immigrants | Romania | 99.5 /100 | #71 | Exceptional 50.9% |
| Immigrants | Pakistan | 99.5 /100 | #72 | Exceptional 50.9% |
| Carpatho Rusyns | 99.3 /100 | #73 | Exceptional 50.6% |
| Lithuanians | 99.3 /100 | #74 | Exceptional 50.6% |
| Immigrants | Scotland | 99.3 /100 | #75 | Exceptional 50.6% |
| Immigrants | Zimbabwe | 99.2 /100 | #76 | Exceptional 50.5% |
| Immigrants | Lebanon | 99.1 /100 | #77 | Exceptional 50.5% |
| Immigrants | Eastern Europe | 99.1 /100 | #78 | Exceptional 50.5% |
| Ethiopians | 99.1 /100 | #79 | Exceptional 50.4% |
| Armenians | 99.1 /100 | #80 | Exceptional 50.4% |