Immigrants from Haiti vs Immigrants from Eritrea 7th Grade
COMPARE
Immigrants from Haiti
Immigrants from Eritrea
7th Grade
7th Grade Comparison
Immigrants from Haiti
Immigrants from Eritrea
94.3%
7TH GRADE
0.0/ 100
METRIC RATING
304th/ 347
METRIC RANK
94.9%
7TH GRADE
0.1/ 100
METRIC RATING
285th/ 347
METRIC RANK
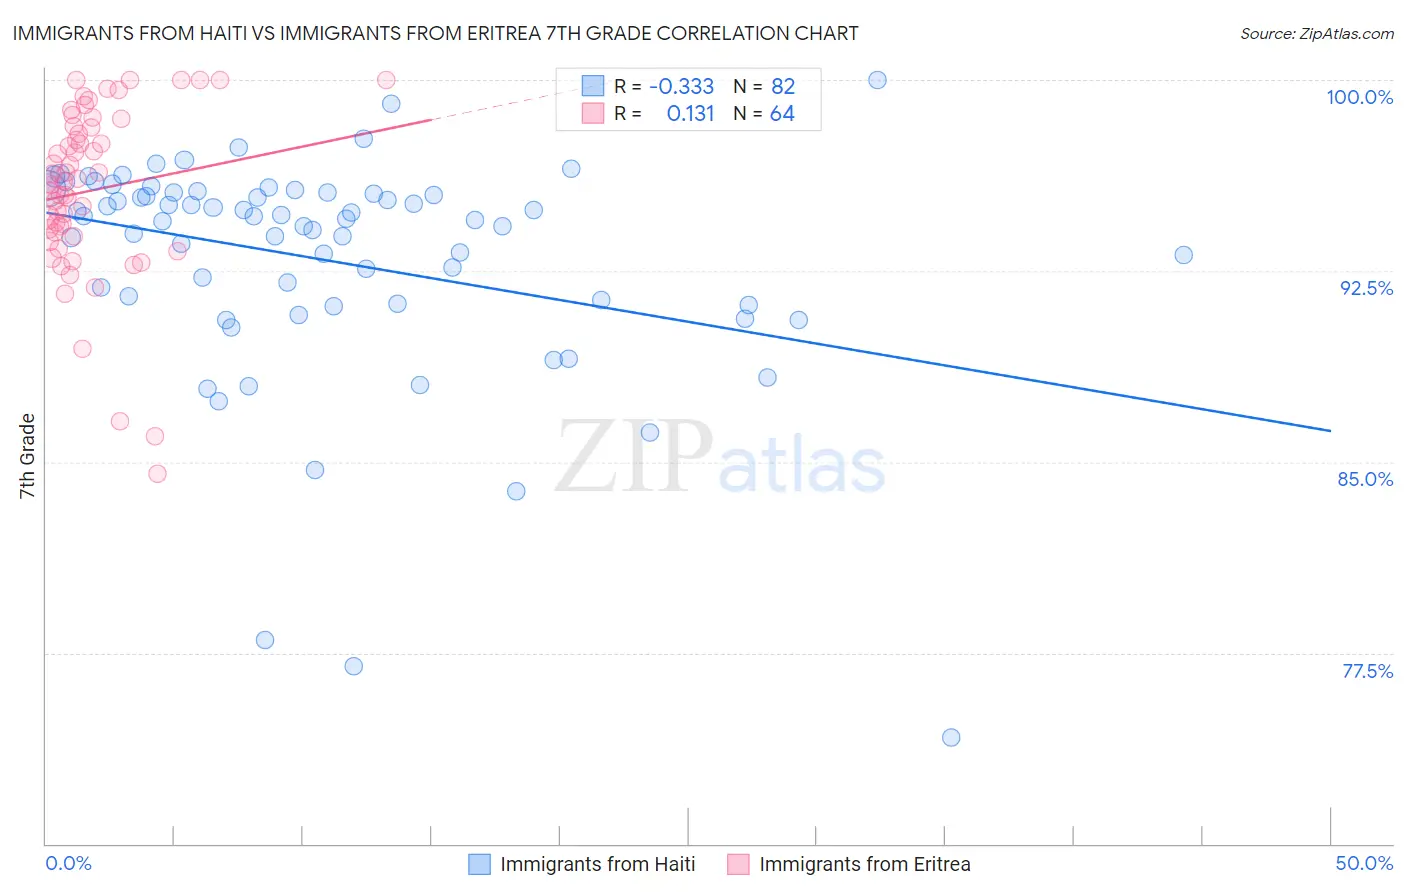
Immigrants from Haiti vs Immigrants from Eritrea 7th Grade Correlation Chart
The statistical analysis conducted on geographies consisting of 225,287,083 people shows a mild negative correlation between the proportion of Immigrants from Haiti and percentage of population with at least 7th grade education in the United States with a correlation coefficient (R) of -0.333 and weighted average of 94.3%. Similarly, the statistical analysis conducted on geographies consisting of 104,754,230 people shows a poor positive correlation between the proportion of Immigrants from Eritrea and percentage of population with at least 7th grade education in the United States with a correlation coefficient (R) of 0.131 and weighted average of 94.9%, a difference of 0.64%.
7th Grade Correlation Summary
| Measurement | Immigrants from Haiti | Immigrants from Eritrea |
| Minimum | 74.2% | 84.5% |
| Maximum | 100.0% | 100.0% |
| Range | 25.8% | 15.5% |
| Mean | 92.9% | 95.7% |
| Median | 94.5% | 96.0% |
| Interquartile 25% (IQ1) | 91.2% | 93.9% |
| Interquartile 75% (IQ3) | 95.6% | 98.2% |
| Interquartile Range (IQR) | 4.4% | 4.2% |
| Standard Deviation (Sample) | 4.5% | 3.4% |
| Standard Deviation (Population) | 4.5% | 3.3% |
Demographics Similar to Immigrants from Haiti and Immigrants from Eritrea by 7th Grade
In terms of 7th grade, the demographic groups most similar to Immigrants from Haiti are Sri Lankan (94.4%, a difference of 0.030%), Immigrants from Dominica (94.5%, a difference of 0.12%), Immigrants from Laos (94.5%, a difference of 0.12%), Immigrants from Burma/Myanmar (94.5%, a difference of 0.15%), and Indonesian (94.5%, a difference of 0.19%). Similarly, the demographic groups most similar to Immigrants from Eritrea are Armenian (95.0%, a difference of 0.010%), Immigrants from Philippines (94.9%, a difference of 0.080%), Immigrants from Peru (94.9%, a difference of 0.090%), British West Indian (94.8%, a difference of 0.10%), and Taiwanese (94.8%, a difference of 0.11%).
| Demographics | Rating | Rank | 7th Grade |
| Armenians | 0.1 /100 | #284 | Tragic 95.0% |
| Immigrants | Eritrea | 0.1 /100 | #285 | Tragic 94.9% |
| Immigrants | Philippines | 0.0 /100 | #286 | Tragic 94.9% |
| Immigrants | Peru | 0.0 /100 | #287 | Tragic 94.9% |
| British West Indians | 0.0 /100 | #288 | Tragic 94.8% |
| Taiwanese | 0.0 /100 | #289 | Tragic 94.8% |
| Malaysians | 0.0 /100 | #290 | Tragic 94.8% |
| Immigrants | Grenada | 0.0 /100 | #291 | Tragic 94.8% |
| Immigrants | West Indies | 0.0 /100 | #292 | Tragic 94.8% |
| Fijians | 0.0 /100 | #293 | Tragic 94.7% |
| Haitians | 0.0 /100 | #294 | Tragic 94.7% |
| Yaqui | 0.0 /100 | #295 | Tragic 94.6% |
| Cubans | 0.0 /100 | #296 | Tragic 94.6% |
| Immigrants | South Eastern Asia | 0.0 /100 | #297 | Tragic 94.5% |
| Indonesians | 0.0 /100 | #298 | Tragic 94.5% |
| Bangladeshis | 0.0 /100 | #299 | Tragic 94.5% |
| Immigrants | Burma/Myanmar | 0.0 /100 | #300 | Tragic 94.5% |
| Immigrants | Dominica | 0.0 /100 | #301 | Tragic 94.5% |
| Immigrants | Laos | 0.0 /100 | #302 | Tragic 94.5% |
| Sri Lankans | 0.0 /100 | #303 | Tragic 94.4% |
| Immigrants | Haiti | 0.0 /100 | #304 | Tragic 94.3% |