West Indian vs Immigrants from Eritrea 7th Grade
COMPARE
West Indian
Immigrants from Eritrea
7th Grade
7th Grade Comparison
West Indians
Immigrants from Eritrea
95.2%
7TH GRADE
0.5/ 100
METRIC RATING
263rd/ 347
METRIC RANK
94.9%
7TH GRADE
0.1/ 100
METRIC RATING
285th/ 347
METRIC RANK
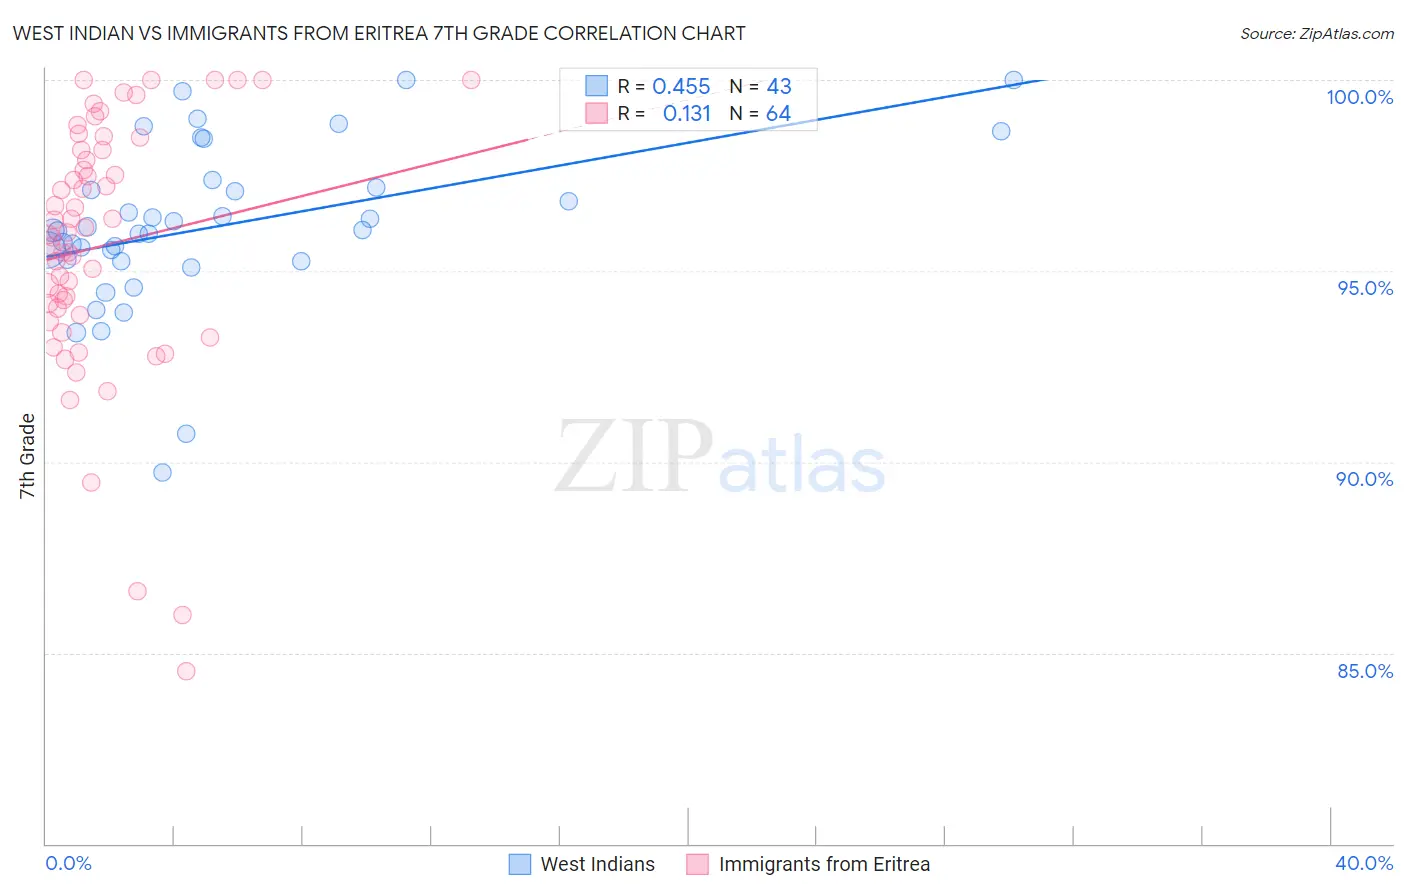
West Indian vs Immigrants from Eritrea 7th Grade Correlation Chart
The statistical analysis conducted on geographies consisting of 254,059,006 people shows a moderate positive correlation between the proportion of West Indians and percentage of population with at least 7th grade education in the United States with a correlation coefficient (R) of 0.455 and weighted average of 95.2%. Similarly, the statistical analysis conducted on geographies consisting of 104,754,230 people shows a poor positive correlation between the proportion of Immigrants from Eritrea and percentage of population with at least 7th grade education in the United States with a correlation coefficient (R) of 0.131 and weighted average of 94.9%, a difference of 0.31%.
7th Grade Correlation Summary
| Measurement | West Indian | Immigrants from Eritrea |
| Minimum | 89.7% | 84.5% |
| Maximum | 100.0% | 100.0% |
| Range | 10.3% | 15.5% |
| Mean | 96.2% | 95.7% |
| Median | 96.1% | 96.0% |
| Interquartile 25% (IQ1) | 95.3% | 93.9% |
| Interquartile 75% (IQ3) | 97.2% | 98.2% |
| Interquartile Range (IQR) | 1.9% | 4.2% |
| Standard Deviation (Sample) | 2.1% | 3.4% |
| Standard Deviation (Population) | 2.1% | 3.3% |
Similar Demographics by 7th Grade
Demographics Similar to West Indians by 7th Grade
In terms of 7th grade, the demographic groups most similar to West Indians are South American (95.2%, a difference of 0.0%), Immigrants from Somalia (95.2%, a difference of 0.0%), Afghan (95.3%, a difference of 0.010%), Immigrants from Nigeria (95.2%, a difference of 0.010%), and Immigrants from Costa Rica (95.3%, a difference of 0.040%).
| Demographics | Rating | Rank | 7th Grade |
| Immigrants | China | 0.7 /100 | #256 | Tragic 95.3% |
| Immigrants | Congo | 0.7 /100 | #257 | Tragic 95.3% |
| Ghanaians | 0.7 /100 | #258 | Tragic 95.3% |
| Immigrants | Costa Rica | 0.6 /100 | #259 | Tragic 95.3% |
| Afghans | 0.5 /100 | #260 | Tragic 95.3% |
| South Americans | 0.5 /100 | #261 | Tragic 95.2% |
| Immigrants | Somalia | 0.5 /100 | #262 | Tragic 95.2% |
| West Indians | 0.5 /100 | #263 | Tragic 95.2% |
| Immigrants | Nigeria | 0.4 /100 | #264 | Tragic 95.2% |
| Immigrants | Uruguay | 0.3 /100 | #265 | Tragic 95.2% |
| Immigrants | Ghana | 0.3 /100 | #266 | Tragic 95.2% |
| Yuman | 0.3 /100 | #267 | Tragic 95.2% |
| Immigrants | Hong Kong | 0.3 /100 | #268 | Tragic 95.2% |
| Trinidadians and Tobagonians | 0.3 /100 | #269 | Tragic 95.2% |
| Houma | 0.2 /100 | #270 | Tragic 95.1% |
Demographics Similar to Immigrants from Eritrea by 7th Grade
In terms of 7th grade, the demographic groups most similar to Immigrants from Eritrea are Immigrants from Barbados (95.0%, a difference of 0.010%), Armenian (95.0%, a difference of 0.010%), Immigrants from Bolivia (95.0%, a difference of 0.070%), Immigrants from St. Vincent and the Grenadines (95.0%, a difference of 0.080%), and Tohono O'odham (95.0%, a difference of 0.080%).
| Demographics | Rating | Rank | 7th Grade |
| Immigrants | Trinidad and Tobago | 0.1 /100 | #278 | Tragic 95.1% |
| Barbadians | 0.1 /100 | #279 | Tragic 95.1% |
| Immigrants | St. Vincent and the Grenadines | 0.1 /100 | #280 | Tragic 95.0% |
| Tohono O'odham | 0.1 /100 | #281 | Tragic 95.0% |
| Immigrants | Bolivia | 0.1 /100 | #282 | Tragic 95.0% |
| Immigrants | Barbados | 0.1 /100 | #283 | Tragic 95.0% |
| Armenians | 0.1 /100 | #284 | Tragic 95.0% |
| Immigrants | Eritrea | 0.1 /100 | #285 | Tragic 94.9% |
| Immigrants | Philippines | 0.0 /100 | #286 | Tragic 94.9% |
| Immigrants | Peru | 0.0 /100 | #287 | Tragic 94.9% |
| British West Indians | 0.0 /100 | #288 | Tragic 94.8% |
| Taiwanese | 0.0 /100 | #289 | Tragic 94.8% |
| Malaysians | 0.0 /100 | #290 | Tragic 94.8% |
| Immigrants | Grenada | 0.0 /100 | #291 | Tragic 94.8% |
| Immigrants | West Indies | 0.0 /100 | #292 | Tragic 94.8% |