Eastern European vs Immigrants from Eritrea 7th Grade
COMPARE
Eastern European
Immigrants from Eritrea
7th Grade
7th Grade Comparison
Eastern Europeans
Immigrants from Eritrea
97.2%
7TH GRADE
100.0/ 100
METRIC RATING
41st/ 347
METRIC RANK
94.9%
7TH GRADE
0.1/ 100
METRIC RATING
285th/ 347
METRIC RANK
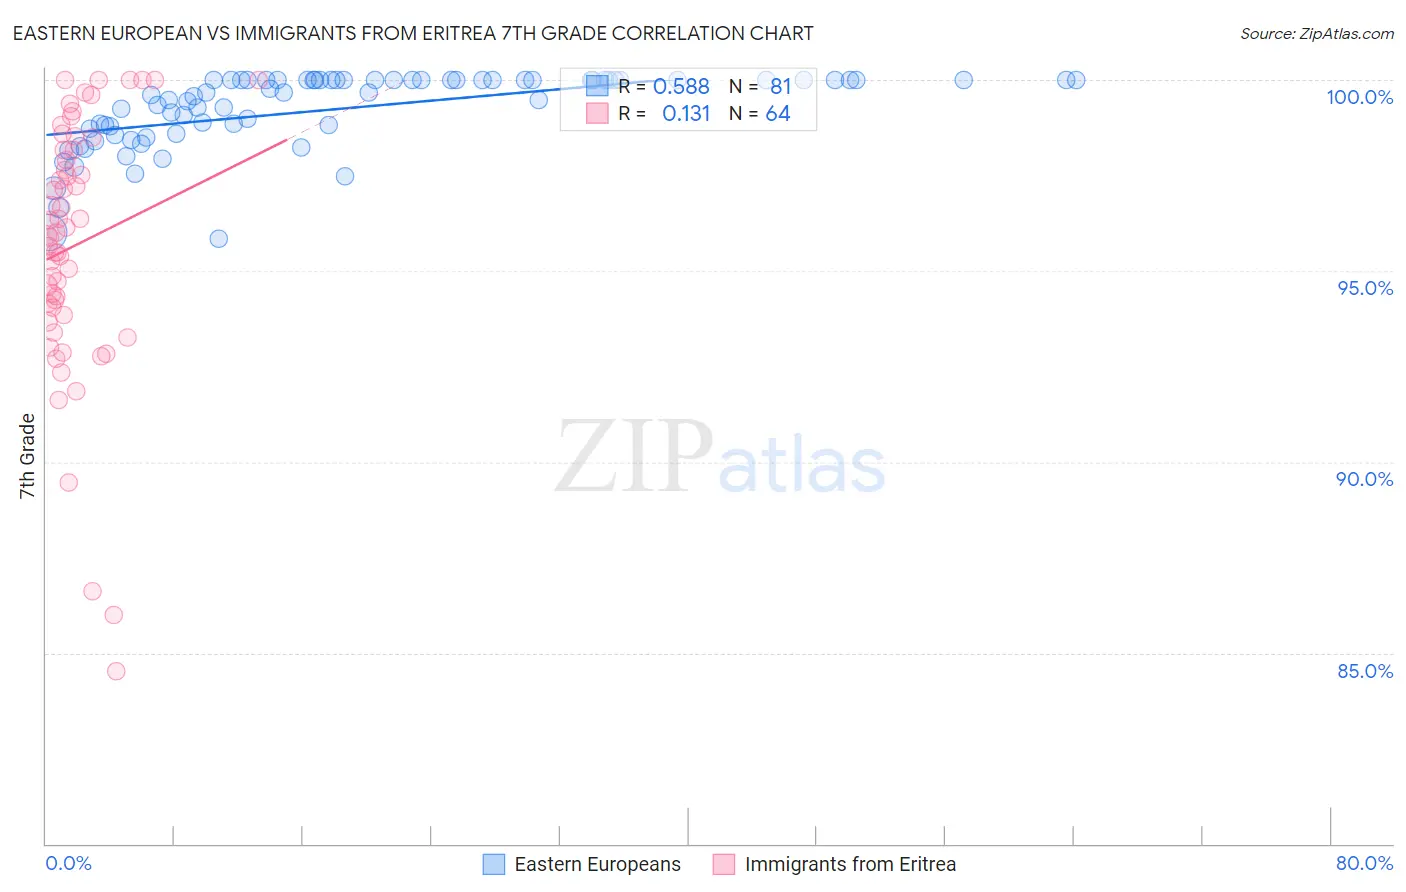
Eastern European vs Immigrants from Eritrea 7th Grade Correlation Chart
The statistical analysis conducted on geographies consisting of 461,247,443 people shows a substantial positive correlation between the proportion of Eastern Europeans and percentage of population with at least 7th grade education in the United States with a correlation coefficient (R) of 0.588 and weighted average of 97.2%. Similarly, the statistical analysis conducted on geographies consisting of 104,754,230 people shows a poor positive correlation between the proportion of Immigrants from Eritrea and percentage of population with at least 7th grade education in the United States with a correlation coefficient (R) of 0.131 and weighted average of 94.9%, a difference of 2.4%.
7th Grade Correlation Summary
| Measurement | Eastern European | Immigrants from Eritrea |
| Minimum | 95.9% | 84.5% |
| Maximum | 100.0% | 100.0% |
| Range | 4.1% | 15.5% |
| Mean | 99.2% | 95.7% |
| Median | 99.7% | 96.0% |
| Interquartile 25% (IQ1) | 98.7% | 93.9% |
| Interquartile 75% (IQ3) | 100.0% | 98.2% |
| Interquartile Range (IQR) | 1.3% | 4.2% |
| Standard Deviation (Sample) | 0.99% | 3.4% |
| Standard Deviation (Population) | 0.98% | 3.3% |
Similar Demographics by 7th Grade
Demographics Similar to Eastern Europeans by 7th Grade
In terms of 7th grade, the demographic groups most similar to Eastern Europeans are Latvian (97.2%, a difference of 0.020%), Luxembourger (97.2%, a difference of 0.020%), Belgian (97.2%, a difference of 0.030%), British (97.2%, a difference of 0.040%), and Chinese (97.1%, a difference of 0.040%).
| Demographics | Rating | Rank | 7th Grade |
| Alaska Natives | 100.0 /100 | #34 | Exceptional 97.3% |
| Swiss | 100.0 /100 | #35 | Exceptional 97.3% |
| Hungarians | 100.0 /100 | #36 | Exceptional 97.2% |
| British | 100.0 /100 | #37 | Exceptional 97.2% |
| Belgians | 100.0 /100 | #38 | Exceptional 97.2% |
| Latvians | 100.0 /100 | #39 | Exceptional 97.2% |
| Luxembourgers | 100.0 /100 | #40 | Exceptional 97.2% |
| Eastern Europeans | 100.0 /100 | #41 | Exceptional 97.2% |
| Chinese | 99.9 /100 | #42 | Exceptional 97.1% |
| Maltese | 99.9 /100 | #43 | Exceptional 97.1% |
| Northern Europeans | 99.9 /100 | #44 | Exceptional 97.1% |
| Czechoslovakians | 99.9 /100 | #45 | Exceptional 97.1% |
| Aleuts | 99.9 /100 | #46 | Exceptional 97.1% |
| Bulgarians | 99.9 /100 | #47 | Exceptional 97.1% |
| Celtics | 99.9 /100 | #48 | Exceptional 97.1% |
Demographics Similar to Immigrants from Eritrea by 7th Grade
In terms of 7th grade, the demographic groups most similar to Immigrants from Eritrea are Immigrants from Barbados (95.0%, a difference of 0.010%), Armenian (95.0%, a difference of 0.010%), Immigrants from Bolivia (95.0%, a difference of 0.070%), Immigrants from St. Vincent and the Grenadines (95.0%, a difference of 0.080%), and Tohono O'odham (95.0%, a difference of 0.080%).
| Demographics | Rating | Rank | 7th Grade |
| Immigrants | Trinidad and Tobago | 0.1 /100 | #278 | Tragic 95.1% |
| Barbadians | 0.1 /100 | #279 | Tragic 95.1% |
| Immigrants | St. Vincent and the Grenadines | 0.1 /100 | #280 | Tragic 95.0% |
| Tohono O'odham | 0.1 /100 | #281 | Tragic 95.0% |
| Immigrants | Bolivia | 0.1 /100 | #282 | Tragic 95.0% |
| Immigrants | Barbados | 0.1 /100 | #283 | Tragic 95.0% |
| Armenians | 0.1 /100 | #284 | Tragic 95.0% |
| Immigrants | Eritrea | 0.1 /100 | #285 | Tragic 94.9% |
| Immigrants | Philippines | 0.0 /100 | #286 | Tragic 94.9% |
| Immigrants | Peru | 0.0 /100 | #287 | Tragic 94.9% |
| British West Indians | 0.0 /100 | #288 | Tragic 94.8% |
| Taiwanese | 0.0 /100 | #289 | Tragic 94.8% |
| Malaysians | 0.0 /100 | #290 | Tragic 94.8% |
| Immigrants | Grenada | 0.0 /100 | #291 | Tragic 94.8% |
| Immigrants | West Indies | 0.0 /100 | #292 | Tragic 94.8% |