Sierra Leonean vs Immigrants from Ecuador College, Under 1 year
COMPARE
Sierra Leonean
Immigrants from Ecuador
College, Under 1 year
College, Under 1 year Comparison
Sierra Leoneans
Immigrants from Ecuador
66.0%
COLLEGE, UNDER 1 YEAR
67.8/ 100
METRIC RATING
157th/ 347
METRIC RANK
58.7%
COLLEGE, UNDER 1 YEAR
0.0/ 100
METRIC RATING
298th/ 347
METRIC RANK
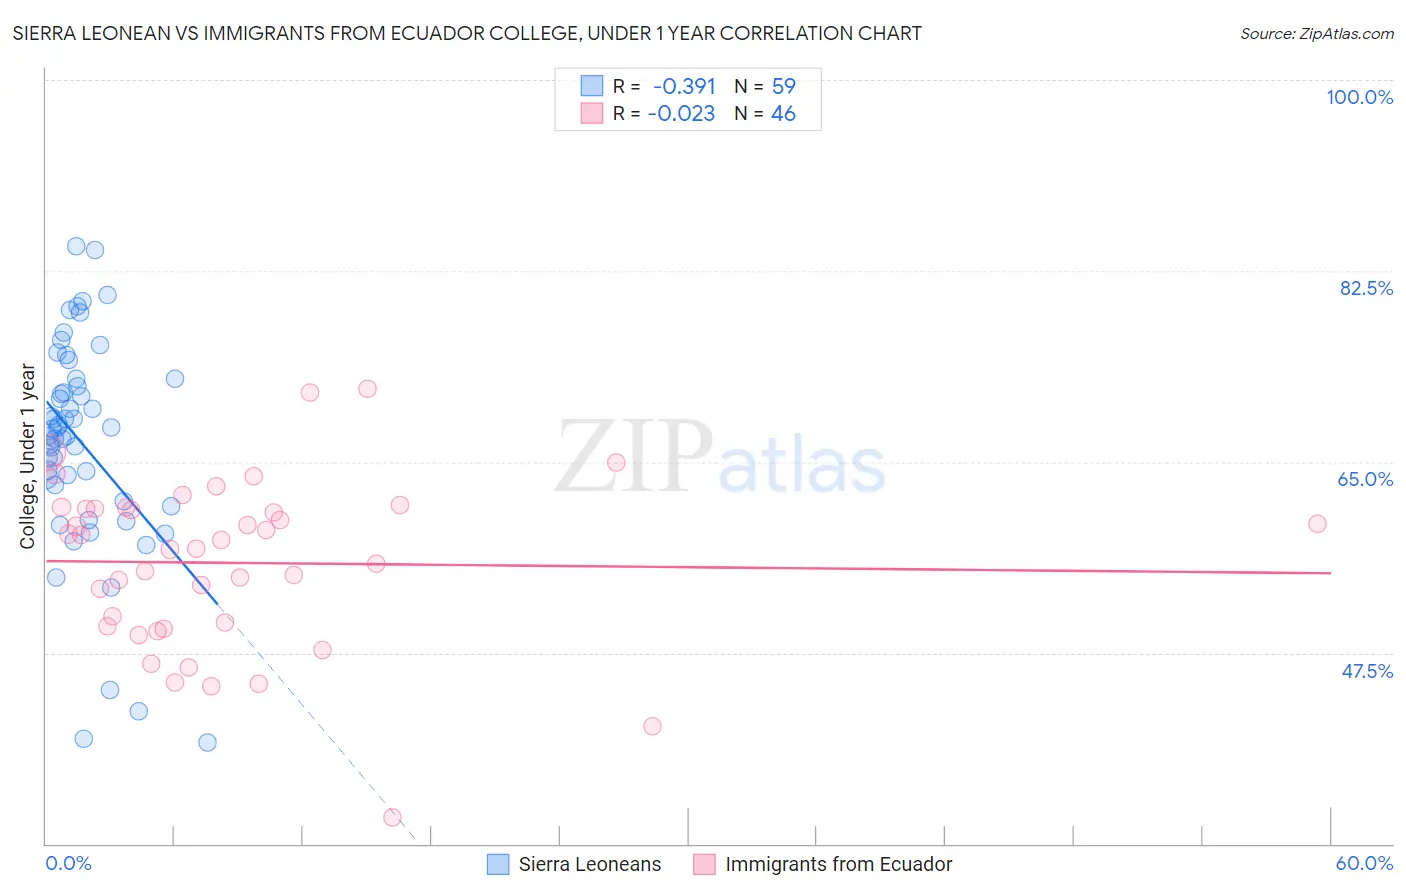
Sierra Leonean vs Immigrants from Ecuador College, Under 1 year Correlation Chart
The statistical analysis conducted on geographies consisting of 83,362,711 people shows a mild negative correlation between the proportion of Sierra Leoneans and percentage of population with at least college, under 1 year education in the United States with a correlation coefficient (R) of -0.391 and weighted average of 66.0%. Similarly, the statistical analysis conducted on geographies consisting of 270,962,752 people shows no correlation between the proportion of Immigrants from Ecuador and percentage of population with at least college, under 1 year education in the United States with a correlation coefficient (R) of -0.023 and weighted average of 58.7%, a difference of 12.3%.
College, Under 1 year Correlation Summary
| Measurement | Sierra Leonean | Immigrants from Ecuador |
| Minimum | 39.3% | 32.4% |
| Maximum | 84.7% | 71.7% |
| Range | 45.5% | 39.3% |
| Mean | 66.7% | 55.7% |
| Median | 68.1% | 57.5% |
| Interquartile 25% (IQ1) | 61.4% | 49.9% |
| Interquartile 75% (IQ3) | 72.6% | 60.7% |
| Interquartile Range (IQR) | 11.2% | 10.8% |
| Standard Deviation (Sample) | 9.9% | 7.8% |
| Standard Deviation (Population) | 9.8% | 7.7% |
Similar Demographics by College, Under 1 year
Demographics Similar to Sierra Leoneans by College, Under 1 year
In terms of college, under 1 year, the demographic groups most similar to Sierra Leoneans are Celtic (65.9%, a difference of 0.030%), Tlingit-Haida (65.9%, a difference of 0.070%), Albanian (65.9%, a difference of 0.080%), Brazilian (65.9%, a difference of 0.090%), and Welsh (66.0%, a difference of 0.10%).
| Demographics | Rating | Rank | College, Under 1 year |
| Immigrants | Iraq | 77.1 /100 | #150 | Good 66.3% |
| Immigrants | Sudan | 76.0 /100 | #151 | Good 66.2% |
| Sudanese | 74.1 /100 | #152 | Good 66.2% |
| Belgians | 73.7 /100 | #153 | Good 66.2% |
| Immigrants | Eritrea | 71.9 /100 | #154 | Good 66.1% |
| Irish | 70.3 /100 | #155 | Good 66.0% |
| Welsh | 69.9 /100 | #156 | Good 66.0% |
| Sierra Leoneans | 67.8 /100 | #157 | Good 66.0% |
| Celtics | 67.3 /100 | #158 | Good 65.9% |
| Tlingit-Haida | 66.4 /100 | #159 | Good 65.9% |
| Albanians | 66.1 /100 | #160 | Good 65.9% |
| Brazilians | 66.0 /100 | #161 | Good 65.9% |
| Koreans | 65.3 /100 | #162 | Good 65.9% |
| Somalis | 62.7 /100 | #163 | Good 65.8% |
| Czechoslovakians | 62.6 /100 | #164 | Good 65.8% |
Demographics Similar to Immigrants from Ecuador by College, Under 1 year
In terms of college, under 1 year, the demographic groups most similar to Immigrants from Ecuador are Cuban (58.6%, a difference of 0.13%), Immigrants from Guyana (58.5%, a difference of 0.39%), Guyanese (59.0%, a difference of 0.50%), Central American Indian (59.0%, a difference of 0.55%), and Immigrants from Grenada (59.1%, a difference of 0.59%).
| Demographics | Rating | Rank | College, Under 1 year |
| Creek | 0.0 /100 | #291 | Tragic 59.3% |
| Nicaraguans | 0.0 /100 | #292 | Tragic 59.2% |
| Seminole | 0.0 /100 | #293 | Tragic 59.1% |
| Immigrants | Belize | 0.0 /100 | #294 | Tragic 59.1% |
| Immigrants | Grenada | 0.0 /100 | #295 | Tragic 59.1% |
| Central American Indians | 0.0 /100 | #296 | Tragic 59.0% |
| Guyanese | 0.0 /100 | #297 | Tragic 59.0% |
| Immigrants | Ecuador | 0.0 /100 | #298 | Tragic 58.7% |
| Cubans | 0.0 /100 | #299 | Tragic 58.6% |
| Immigrants | Guyana | 0.0 /100 | #300 | Tragic 58.5% |
| Mexican American Indians | 0.0 /100 | #301 | Tragic 58.1% |
| Apache | 0.0 /100 | #302 | Tragic 58.0% |
| Immigrants | Dominica | 0.0 /100 | #303 | Tragic 57.9% |
| Kiowa | 0.0 /100 | #304 | Tragic 57.8% |
| Haitians | 0.0 /100 | #305 | Tragic 57.8% |