Immigrants from Mexico vs Immigrants from Ecuador College, Under 1 year
COMPARE
Immigrants from Mexico
Immigrants from Ecuador
College, Under 1 year
College, Under 1 year Comparison
Immigrants from Mexico
Immigrants from Ecuador
53.7%
COLLEGE, UNDER 1 YEAR
0.0/ 100
METRIC RATING
342nd/ 347
METRIC RANK
58.7%
COLLEGE, UNDER 1 YEAR
0.0/ 100
METRIC RATING
298th/ 347
METRIC RANK
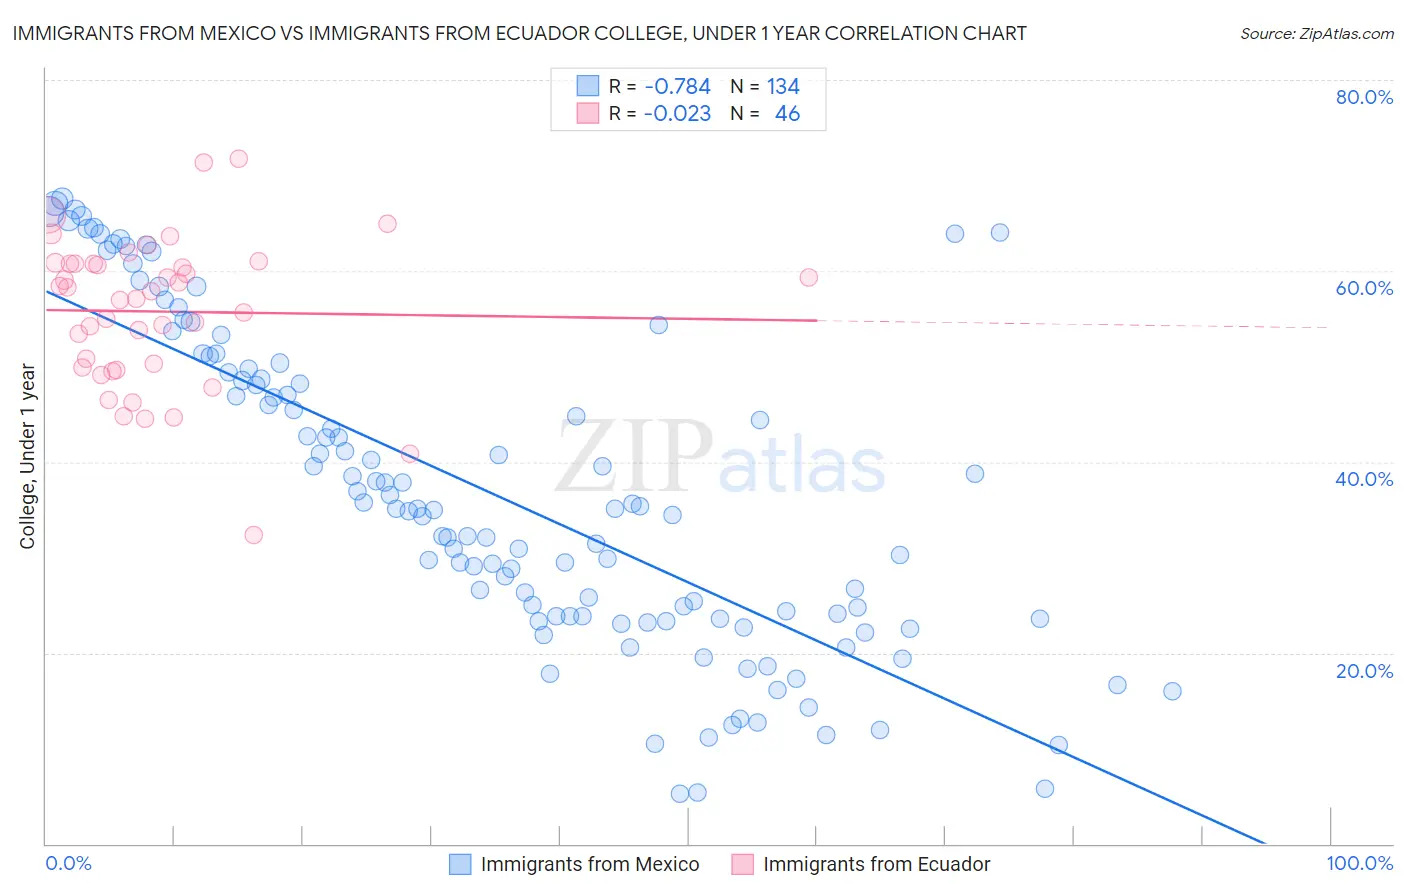
Immigrants from Mexico vs Immigrants from Ecuador College, Under 1 year Correlation Chart
The statistical analysis conducted on geographies consisting of 513,757,474 people shows a strong negative correlation between the proportion of Immigrants from Mexico and percentage of population with at least college, under 1 year education in the United States with a correlation coefficient (R) of -0.784 and weighted average of 53.7%. Similarly, the statistical analysis conducted on geographies consisting of 270,962,752 people shows no correlation between the proportion of Immigrants from Ecuador and percentage of population with at least college, under 1 year education in the United States with a correlation coefficient (R) of -0.023 and weighted average of 58.7%, a difference of 9.5%.
College, Under 1 year Correlation Summary
| Measurement | Immigrants from Mexico | Immigrants from Ecuador |
| Minimum | 5.3% | 32.4% |
| Maximum | 67.5% | 71.7% |
| Range | 62.2% | 39.3% |
| Mean | 36.8% | 55.7% |
| Median | 35.1% | 57.5% |
| Interquartile 25% (IQ1) | 23.8% | 49.9% |
| Interquartile 75% (IQ3) | 49.4% | 60.7% |
| Interquartile Range (IQR) | 25.6% | 10.8% |
| Standard Deviation (Sample) | 16.6% | 7.8% |
| Standard Deviation (Population) | 16.5% | 7.7% |
Similar Demographics by College, Under 1 year
Demographics Similar to Immigrants from Mexico by College, Under 1 year
In terms of college, under 1 year, the demographic groups most similar to Immigrants from Mexico are Immigrants from Cabo Verde (53.7%, a difference of 0.060%), Spanish American Indian (54.0%, a difference of 0.57%), Immigrants from Dominican Republic (54.0%, a difference of 0.65%), Lumbee (54.2%, a difference of 1.1%), and Immigrants from Central America (54.4%, a difference of 1.5%).
| Demographics | Rating | Rank | College, Under 1 year |
| Yuman | 0.0 /100 | #333 | Tragic 55.1% |
| Immigrants | Azores | 0.0 /100 | #334 | Tragic 54.7% |
| Inupiat | 0.0 /100 | #335 | Tragic 54.6% |
| Pennsylvania Germans | 0.0 /100 | #336 | Tragic 54.5% |
| Immigrants | Central America | 0.0 /100 | #337 | Tragic 54.4% |
| Lumbee | 0.0 /100 | #338 | Tragic 54.2% |
| Immigrants | Dominican Republic | 0.0 /100 | #339 | Tragic 54.0% |
| Spanish American Indians | 0.0 /100 | #340 | Tragic 54.0% |
| Immigrants | Cabo Verde | 0.0 /100 | #341 | Tragic 53.7% |
| Immigrants | Mexico | 0.0 /100 | #342 | Tragic 53.7% |
| Tohono O'odham | 0.0 /100 | #343 | Tragic 52.8% |
| Yakama | 0.0 /100 | #344 | Tragic 52.6% |
| Pima | 0.0 /100 | #345 | Tragic 51.4% |
| Houma | 0.0 /100 | #346 | Tragic 47.6% |
| Yup'ik | 0.0 /100 | #347 | Tragic 45.8% |
Demographics Similar to Immigrants from Ecuador by College, Under 1 year
In terms of college, under 1 year, the demographic groups most similar to Immigrants from Ecuador are Cuban (58.6%, a difference of 0.13%), Immigrants from Guyana (58.5%, a difference of 0.39%), Guyanese (59.0%, a difference of 0.50%), Central American Indian (59.0%, a difference of 0.55%), and Immigrants from Grenada (59.1%, a difference of 0.59%).
| Demographics | Rating | Rank | College, Under 1 year |
| Creek | 0.0 /100 | #291 | Tragic 59.3% |
| Nicaraguans | 0.0 /100 | #292 | Tragic 59.2% |
| Seminole | 0.0 /100 | #293 | Tragic 59.1% |
| Immigrants | Belize | 0.0 /100 | #294 | Tragic 59.1% |
| Immigrants | Grenada | 0.0 /100 | #295 | Tragic 59.1% |
| Central American Indians | 0.0 /100 | #296 | Tragic 59.0% |
| Guyanese | 0.0 /100 | #297 | Tragic 59.0% |
| Immigrants | Ecuador | 0.0 /100 | #298 | Tragic 58.7% |
| Cubans | 0.0 /100 | #299 | Tragic 58.6% |
| Immigrants | Guyana | 0.0 /100 | #300 | Tragic 58.5% |
| Mexican American Indians | 0.0 /100 | #301 | Tragic 58.1% |
| Apache | 0.0 /100 | #302 | Tragic 58.0% |
| Immigrants | Dominica | 0.0 /100 | #303 | Tragic 57.9% |
| Kiowa | 0.0 /100 | #304 | Tragic 57.8% |
| Haitians | 0.0 /100 | #305 | Tragic 57.8% |