American vs Immigrants from Ecuador College, Under 1 year
COMPARE
American
Immigrants from Ecuador
College, Under 1 year
College, Under 1 year Comparison
Americans
Immigrants from Ecuador
61.0%
COLLEGE, UNDER 1 YEAR
0.2/ 100
METRIC RATING
267th/ 347
METRIC RANK
58.7%
COLLEGE, UNDER 1 YEAR
0.0/ 100
METRIC RATING
298th/ 347
METRIC RANK
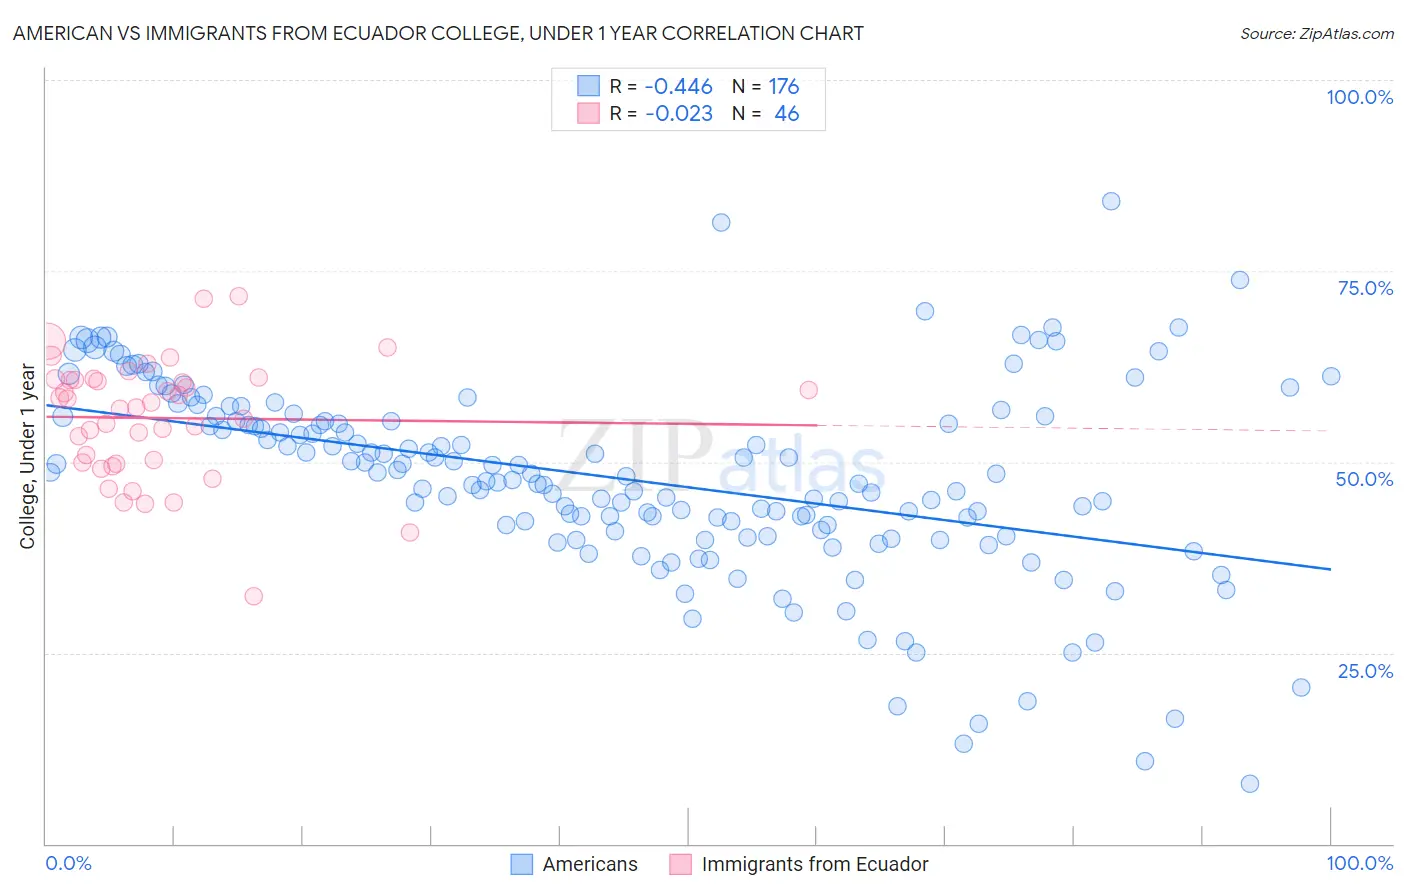
American vs Immigrants from Ecuador College, Under 1 year Correlation Chart
The statistical analysis conducted on geographies consisting of 581,978,241 people shows a moderate negative correlation between the proportion of Americans and percentage of population with at least college, under 1 year education in the United States with a correlation coefficient (R) of -0.446 and weighted average of 61.0%. Similarly, the statistical analysis conducted on geographies consisting of 270,962,752 people shows no correlation between the proportion of Immigrants from Ecuador and percentage of population with at least college, under 1 year education in the United States with a correlation coefficient (R) of -0.023 and weighted average of 58.7%, a difference of 3.8%.
College, Under 1 year Correlation Summary
| Measurement | American | Immigrants from Ecuador |
| Minimum | 7.8% | 32.4% |
| Maximum | 84.1% | 71.7% |
| Range | 76.3% | 39.3% |
| Mean | 47.8% | 55.7% |
| Median | 48.2% | 57.5% |
| Interquartile 25% (IQ1) | 41.1% | 49.9% |
| Interquartile 75% (IQ3) | 55.9% | 60.7% |
| Interquartile Range (IQR) | 14.9% | 10.8% |
| Standard Deviation (Sample) | 12.8% | 7.8% |
| Standard Deviation (Population) | 12.8% | 7.7% |
Similar Demographics by College, Under 1 year
Demographics Similar to Americans by College, Under 1 year
In terms of college, under 1 year, the demographic groups most similar to Americans are Alaskan Athabascan (61.0%, a difference of 0.010%), Trinidadian and Tobagonian (61.1%, a difference of 0.13%), Immigrants from Bahamas (61.1%, a difference of 0.13%), Shoshone (61.1%, a difference of 0.19%), and Barbadian (61.1%, a difference of 0.20%).
| Demographics | Rating | Rank | College, Under 1 year |
| Blackfeet | 0.3 /100 | #260 | Tragic 61.1% |
| Africans | 0.3 /100 | #261 | Tragic 61.1% |
| Barbadians | 0.2 /100 | #262 | Tragic 61.1% |
| Shoshone | 0.2 /100 | #263 | Tragic 61.1% |
| Trinidadians and Tobagonians | 0.2 /100 | #264 | Tragic 61.1% |
| Immigrants | Bahamas | 0.2 /100 | #265 | Tragic 61.1% |
| Alaskan Athabascans | 0.2 /100 | #266 | Tragic 61.0% |
| Americans | 0.2 /100 | #267 | Tragic 61.0% |
| Immigrants | Trinidad and Tobago | 0.1 /100 | #268 | Tragic 60.7% |
| Immigrants | West Indies | 0.1 /100 | #269 | Tragic 60.6% |
| Cheyenne | 0.1 /100 | #270 | Tragic 60.6% |
| U.S. Virgin Islanders | 0.1 /100 | #271 | Tragic 60.6% |
| Jamaicans | 0.1 /100 | #272 | Tragic 60.5% |
| Chickasaw | 0.1 /100 | #273 | Tragic 60.4% |
| Alaska Natives | 0.1 /100 | #274 | Tragic 60.4% |
Demographics Similar to Immigrants from Ecuador by College, Under 1 year
In terms of college, under 1 year, the demographic groups most similar to Immigrants from Ecuador are Cuban (58.6%, a difference of 0.13%), Immigrants from Guyana (58.5%, a difference of 0.39%), Guyanese (59.0%, a difference of 0.50%), Central American Indian (59.0%, a difference of 0.55%), and Immigrants from Grenada (59.1%, a difference of 0.59%).
| Demographics | Rating | Rank | College, Under 1 year |
| Creek | 0.0 /100 | #291 | Tragic 59.3% |
| Nicaraguans | 0.0 /100 | #292 | Tragic 59.2% |
| Seminole | 0.0 /100 | #293 | Tragic 59.1% |
| Immigrants | Belize | 0.0 /100 | #294 | Tragic 59.1% |
| Immigrants | Grenada | 0.0 /100 | #295 | Tragic 59.1% |
| Central American Indians | 0.0 /100 | #296 | Tragic 59.0% |
| Guyanese | 0.0 /100 | #297 | Tragic 59.0% |
| Immigrants | Ecuador | 0.0 /100 | #298 | Tragic 58.7% |
| Cubans | 0.0 /100 | #299 | Tragic 58.6% |
| Immigrants | Guyana | 0.0 /100 | #300 | Tragic 58.5% |
| Mexican American Indians | 0.0 /100 | #301 | Tragic 58.1% |
| Apache | 0.0 /100 | #302 | Tragic 58.0% |
| Immigrants | Dominica | 0.0 /100 | #303 | Tragic 57.9% |
| Kiowa | 0.0 /100 | #304 | Tragic 57.8% |
| Haitians | 0.0 /100 | #305 | Tragic 57.8% |