Sierra Leonean vs Turkish College, Under 1 year
COMPARE
Sierra Leonean
Turkish
College, Under 1 year
College, Under 1 year Comparison
Sierra Leoneans
Turks
66.0%
COLLEGE, UNDER 1 YEAR
67.8/ 100
METRIC RATING
157th/ 347
METRIC RANK
70.7%
COLLEGE, UNDER 1 YEAR
99.9/ 100
METRIC RATING
32nd/ 347
METRIC RANK
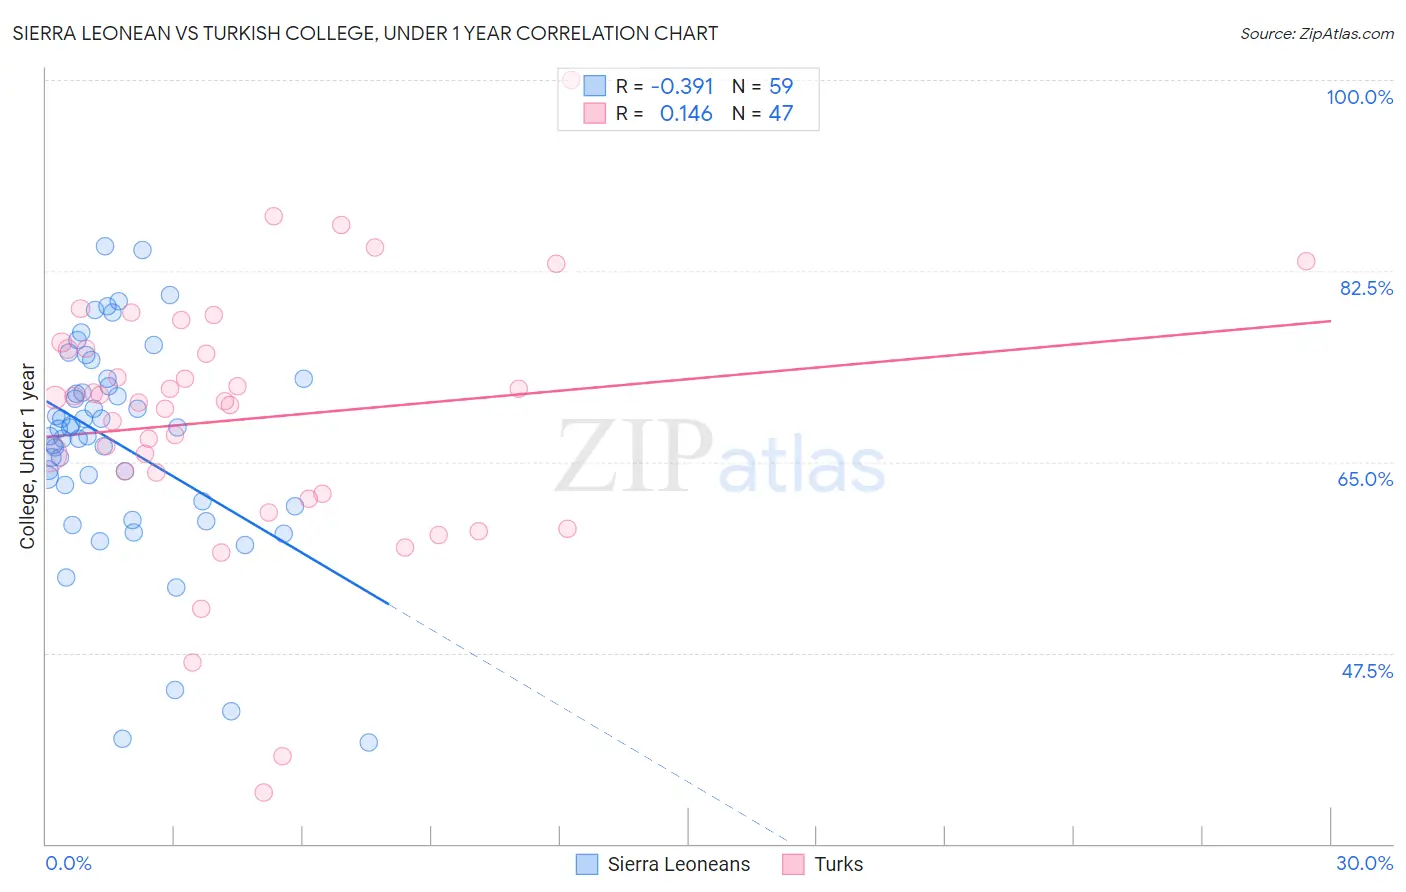
Sierra Leonean vs Turkish College, Under 1 year Correlation Chart
The statistical analysis conducted on geographies consisting of 83,362,711 people shows a mild negative correlation between the proportion of Sierra Leoneans and percentage of population with at least college, under 1 year education in the United States with a correlation coefficient (R) of -0.391 and weighted average of 66.0%. Similarly, the statistical analysis conducted on geographies consisting of 271,864,133 people shows a poor positive correlation between the proportion of Turks and percentage of population with at least college, under 1 year education in the United States with a correlation coefficient (R) of 0.146 and weighted average of 70.7%, a difference of 7.2%.
College, Under 1 year Correlation Summary
| Measurement | Sierra Leonean | Turkish |
| Minimum | 39.3% | 34.7% |
| Maximum | 84.7% | 100.0% |
| Range | 45.5% | 65.3% |
| Mean | 66.7% | 69.0% |
| Median | 68.1% | 70.5% |
| Interquartile 25% (IQ1) | 61.4% | 62.0% |
| Interquartile 75% (IQ3) | 72.6% | 75.3% |
| Interquartile Range (IQR) | 11.2% | 13.3% |
| Standard Deviation (Sample) | 9.9% | 12.1% |
| Standard Deviation (Population) | 9.8% | 11.9% |
Similar Demographics by College, Under 1 year
Demographics Similar to Sierra Leoneans by College, Under 1 year
In terms of college, under 1 year, the demographic groups most similar to Sierra Leoneans are Celtic (65.9%, a difference of 0.030%), Tlingit-Haida (65.9%, a difference of 0.070%), Albanian (65.9%, a difference of 0.080%), Brazilian (65.9%, a difference of 0.090%), and Welsh (66.0%, a difference of 0.10%).
| Demographics | Rating | Rank | College, Under 1 year |
| Immigrants | Iraq | 77.1 /100 | #150 | Good 66.3% |
| Immigrants | Sudan | 76.0 /100 | #151 | Good 66.2% |
| Sudanese | 74.1 /100 | #152 | Good 66.2% |
| Belgians | 73.7 /100 | #153 | Good 66.2% |
| Immigrants | Eritrea | 71.9 /100 | #154 | Good 66.1% |
| Irish | 70.3 /100 | #155 | Good 66.0% |
| Welsh | 69.9 /100 | #156 | Good 66.0% |
| Sierra Leoneans | 67.8 /100 | #157 | Good 66.0% |
| Celtics | 67.3 /100 | #158 | Good 65.9% |
| Tlingit-Haida | 66.4 /100 | #159 | Good 65.9% |
| Albanians | 66.1 /100 | #160 | Good 65.9% |
| Brazilians | 66.0 /100 | #161 | Good 65.9% |
| Koreans | 65.3 /100 | #162 | Good 65.9% |
| Somalis | 62.7 /100 | #163 | Good 65.8% |
| Czechoslovakians | 62.6 /100 | #164 | Good 65.8% |
Demographics Similar to Turks by College, Under 1 year
In terms of college, under 1 year, the demographic groups most similar to Turks are Indian (Asian) (70.8%, a difference of 0.080%), Immigrants from South Africa (70.6%, a difference of 0.17%), Estonian (70.6%, a difference of 0.18%), Immigrants from China (70.9%, a difference of 0.19%), and Russian (70.5%, a difference of 0.27%).
| Demographics | Rating | Rank | College, Under 1 year |
| Bulgarians | 100.0 /100 | #25 | Exceptional 71.1% |
| Immigrants | Denmark | 100.0 /100 | #26 | Exceptional 71.0% |
| Immigrants | Ireland | 100.0 /100 | #27 | Exceptional 71.0% |
| Immigrants | Hong Kong | 100.0 /100 | #28 | Exceptional 71.0% |
| Immigrants | France | 100.0 /100 | #29 | Exceptional 71.0% |
| Immigrants | China | 99.9 /100 | #30 | Exceptional 70.9% |
| Indians (Asian) | 99.9 /100 | #31 | Exceptional 70.8% |
| Turks | 99.9 /100 | #32 | Exceptional 70.7% |
| Immigrants | South Africa | 99.9 /100 | #33 | Exceptional 70.6% |
| Estonians | 99.9 /100 | #34 | Exceptional 70.6% |
| Russians | 99.9 /100 | #35 | Exceptional 70.5% |
| Immigrants | Sri Lanka | 99.9 /100 | #36 | Exceptional 70.5% |
| Immigrants | Saudi Arabia | 99.9 /100 | #37 | Exceptional 70.4% |
| Australians | 99.9 /100 | #38 | Exceptional 70.4% |
| Bhutanese | 99.9 /100 | #39 | Exceptional 70.3% |