Immigrants from El Salvador vs Immigrants from Ecuador College, Under 1 year
COMPARE
Immigrants from El Salvador
Immigrants from Ecuador
College, Under 1 year
College, Under 1 year Comparison
Immigrants from El Salvador
Immigrants from Ecuador
56.4%
COLLEGE, UNDER 1 YEAR
0.0/ 100
METRIC RATING
324th/ 347
METRIC RANK
58.7%
COLLEGE, UNDER 1 YEAR
0.0/ 100
METRIC RATING
298th/ 347
METRIC RANK
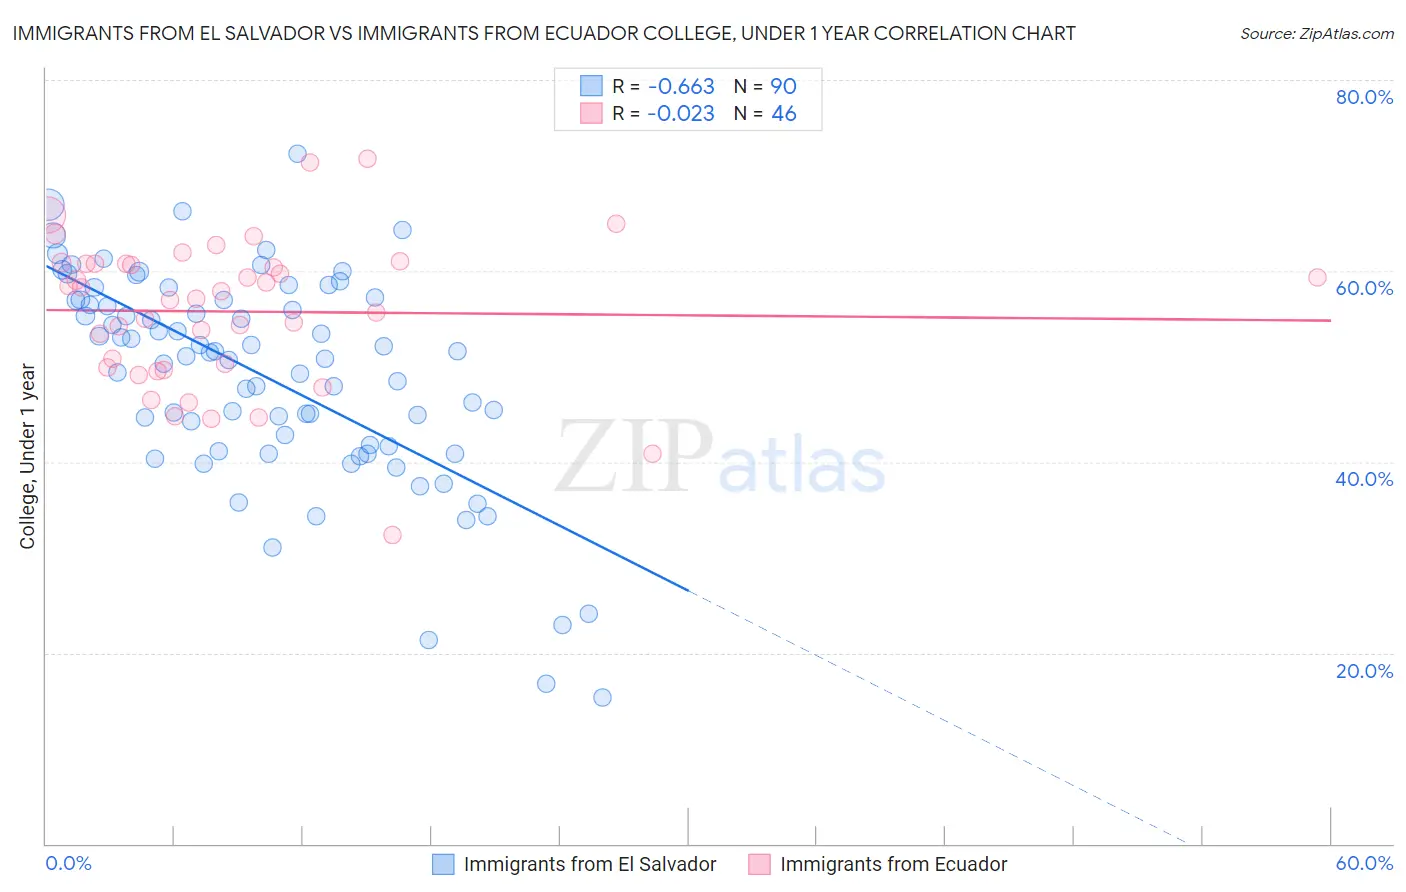
Immigrants from El Salvador vs Immigrants from Ecuador College, Under 1 year Correlation Chart
The statistical analysis conducted on geographies consisting of 357,850,135 people shows a significant negative correlation between the proportion of Immigrants from El Salvador and percentage of population with at least college, under 1 year education in the United States with a correlation coefficient (R) of -0.663 and weighted average of 56.4%. Similarly, the statistical analysis conducted on geographies consisting of 270,962,752 people shows no correlation between the proportion of Immigrants from Ecuador and percentage of population with at least college, under 1 year education in the United States with a correlation coefficient (R) of -0.023 and weighted average of 58.7%, a difference of 4.1%.
College, Under 1 year Correlation Summary
| Measurement | Immigrants from El Salvador | Immigrants from Ecuador |
| Minimum | 15.3% | 32.4% |
| Maximum | 72.3% | 71.7% |
| Range | 56.9% | 39.3% |
| Mean | 48.9% | 55.7% |
| Median | 51.3% | 57.5% |
| Interquartile 25% (IQ1) | 41.6% | 49.9% |
| Interquartile 75% (IQ3) | 57.0% | 60.7% |
| Interquartile Range (IQR) | 15.4% | 10.8% |
| Standard Deviation (Sample) | 11.1% | 7.8% |
| Standard Deviation (Population) | 11.1% | 7.7% |
Similar Demographics by College, Under 1 year
Demographics Similar to Immigrants from El Salvador by College, Under 1 year
In terms of college, under 1 year, the demographic groups most similar to Immigrants from El Salvador are Immigrants from Latin America (56.3%, a difference of 0.10%), Immigrants from Honduras (56.5%, a difference of 0.13%), Navajo (56.3%, a difference of 0.25%), Immigrants from Caribbean (56.6%, a difference of 0.31%), and Immigrants from Guatemala (56.2%, a difference of 0.34%).
| Demographics | Rating | Rank | College, Under 1 year |
| Hispanics or Latinos | 0.0 /100 | #317 | Tragic 57.0% |
| Immigrants | Haiti | 0.0 /100 | #318 | Tragic 56.9% |
| Puerto Ricans | 0.0 /100 | #319 | Tragic 56.8% |
| Guatemalans | 0.0 /100 | #320 | Tragic 56.8% |
| Natives/Alaskans | 0.0 /100 | #321 | Tragic 56.6% |
| Immigrants | Caribbean | 0.0 /100 | #322 | Tragic 56.6% |
| Immigrants | Honduras | 0.0 /100 | #323 | Tragic 56.5% |
| Immigrants | El Salvador | 0.0 /100 | #324 | Tragic 56.4% |
| Immigrants | Latin America | 0.0 /100 | #325 | Tragic 56.3% |
| Navajo | 0.0 /100 | #326 | Tragic 56.3% |
| Immigrants | Guatemala | 0.0 /100 | #327 | Tragic 56.2% |
| Cape Verdeans | 0.0 /100 | #328 | Tragic 56.0% |
| Immigrants | Cuba | 0.0 /100 | #329 | Tragic 55.7% |
| Mexicans | 0.0 /100 | #330 | Tragic 55.6% |
| Dominicans | 0.0 /100 | #331 | Tragic 55.5% |
Demographics Similar to Immigrants from Ecuador by College, Under 1 year
In terms of college, under 1 year, the demographic groups most similar to Immigrants from Ecuador are Cuban (58.6%, a difference of 0.13%), Immigrants from Guyana (58.5%, a difference of 0.39%), Guyanese (59.0%, a difference of 0.50%), Central American Indian (59.0%, a difference of 0.55%), and Immigrants from Grenada (59.1%, a difference of 0.59%).
| Demographics | Rating | Rank | College, Under 1 year |
| Creek | 0.0 /100 | #291 | Tragic 59.3% |
| Nicaraguans | 0.0 /100 | #292 | Tragic 59.2% |
| Seminole | 0.0 /100 | #293 | Tragic 59.1% |
| Immigrants | Belize | 0.0 /100 | #294 | Tragic 59.1% |
| Immigrants | Grenada | 0.0 /100 | #295 | Tragic 59.1% |
| Central American Indians | 0.0 /100 | #296 | Tragic 59.0% |
| Guyanese | 0.0 /100 | #297 | Tragic 59.0% |
| Immigrants | Ecuador | 0.0 /100 | #298 | Tragic 58.7% |
| Cubans | 0.0 /100 | #299 | Tragic 58.6% |
| Immigrants | Guyana | 0.0 /100 | #300 | Tragic 58.5% |
| Mexican American Indians | 0.0 /100 | #301 | Tragic 58.1% |
| Apache | 0.0 /100 | #302 | Tragic 58.0% |
| Immigrants | Dominica | 0.0 /100 | #303 | Tragic 57.9% |
| Kiowa | 0.0 /100 | #304 | Tragic 57.8% |
| Haitians | 0.0 /100 | #305 | Tragic 57.8% |